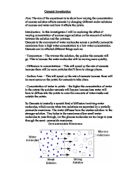
So as the sucrose concentration is increased the number of active sites that are occupied will also increase as the substrate reacts with the enzyme. However, there will come a point where all of the active sites of the enzymes are occupied, so that no matter how much the substrate is increased, the rate of reaction cannot work at a faster pace. On the graph above this is illustrated as point V-max. After this point has been reached, unless one of the controlling or environmental factors are changed, or the enzyme concentration, then the rate of reaction physically can not increase.
Fair Test:
To ensure that the experiment I done was fair and not invalid in anyway I made sure that all of my variables were kept constant and weren’t changed. There are a number of factors which affect enzyme activity, to which particular attention had to be paid, these were:
- Temperature – As the temperature increases, then this means that the rate of a chemical reaction also increases. Also, the molecules will receive energy through the form of heat, which will cause them to speed up, and so substrates will be more likely to collide with the active site of enzymes. To keep the experiment fair, I kept the temperature constant at 38°c, which I measured with a thermometer kept inside each of the solutions.
- Concentrations - the concentration of the sucrose was measured carefully before putting it into test tubes, as was the sucrase. The calculations done to measure the ratio of water to sucrose used in order to lower the concentration, were checked to ensure that they were correct.
- PH of solution – Most enzymes function best, or at their optimum, at a particular PH at which they are accustomed to working in depending on where they are naturally found, e.g. the gastric enzymes which work in the stomach will work best at acidic PH’s of less then 7. For this reason all of my experiments were done at a PH of 7 which is neutral. I tested 1cm3 of each solution which has sucrose and sucrase added to it, and using universal indicator, I tested the PH, and got a green colour, indicating neutrality.
- Inhibitors - These, like substrate, fits into the active site of the enzyme, but unlike substrate, it does not take part in any reaction, and it affects the active site by not allowing enzyme-substrate complex’s to be formed. This further causes the rate of reaction to be decreased. In my experiment no inhibitors were used, and all of the work surface near to the experiment was kept clear of inhibitors to ensure that contamination was not a possibility.
- Acidified Potassium Manganate (vii) –I kept the levels of acidified potassium manganate constant throughout the experiment, as if the level of this varied, then the time it takes for it to decolourise would be longer or shorter then is actually the case if the experiment was done more accurately. For this reason, I paid explicit attention to the levels of this.
- Equipment – All of the equipment that was used was thoroughly washed so that any possibility of contamination from previous usage was eradicated, and was also dried so that the concentrations were not affected.
Apparatus:
- water bath – one at 38°C and one at 60°C
- test tubes
- stop clock
- measuring cylinders
- acidified potassium manganate (vii)
- water
- sucrose (In varying concentrations in the percentages: 2, 1.6, 1.2, 0.8, 0.4, 0.0 )
- sucrase (1% concentration)
- thermometer
- 4 pipettes
- Bunsen burner
- Tripod
- Gauze
- Fireproof tile
- beaker
Method:
I will vary the concentration of the sucrose by mixing it with the proportional parts of water, for each test. The presence of water is necessary to break down the 1, 4 glycosidic bond in the disaccharide sucrose. I will measure the presence of glucose, by using acidified potassium manganate which decolourises in the presence of reducing sugars, and I will measure how long it takes for each sucrose concentration to decolourise the acidified potassium manganate, and the times collected will be used to prove/disprove my theory. If the time it takes for acidified potassium manganate to decolourise is comparatively long, then this means that the rate of reaction is quite slow.
I will take 6 test tubes, and fill each one up with sucrose solution of varying concentrations ranging from 2% to 0%, moving down in 0.4. All of the sucrose solutions will have a volume of 6cm3, and the concentrations will be changed by the addition of water. Therefore the test tube with 4.8cm3 sucrose, will have 1.2cm3 of water added, so that the overall volume is kept constant, and only the concentration is changed. As the volume used for all of the solutions is 6cm3, to work out the proportions of water to sucrose I simply divided 6 by 2, as 6 is the volume being used, and 2 is the percentage concentration of the sucrose, and I multiplied this number by the desired sucrose concentration. I then measures out 6cm3 of sucrase solution, and placed both the sucrose and sucrase into a water bath at 38 degrees Celsius. I also measured out 6cm3 of acidified potassium manganate (vii) and placed this inside that water bath. This ensures that all solutions are at the same temperature. I then mix the sucrase solution with the sucrose solution for 30 seconds, before adding this solution to 6cm3 of acidified potassium manganate. This solution would be put into the water bath at 60 degrees Celsius and I would measure how long it takes for the acidified potassium manganate to turn colourless, whilst timing with a stop clock. I repeated the test for each separate concentration 3 times so that these results could be averaged out and more precise results could be obtained.
Experiment:
Preliminary Results:
From the preliminary results I found out that, as the sucrose concentration was increased, the time taken for the acidified potassium manganate to decolourise, which shows that my hypothesis is on the right lines, but I need to go into more detail, to get more accurate results. I chose to do 0%, 1% and 2% because this gives a well rounded overview as it represents both of the extremes of the experiment, full concentration of sucrose and no sucrose present at all, and it has half concentration of sucrose as well, which shows that the other two results are correct. This also acted as my control experiment, as it shows that with no sucrose present, the acidified potassium manganate did not decolourise, therefore showing that none of the chemicals being used are contaminated.
Results:
Table of Averages:
Conclusion:
The findings of my experiment have proved my theory correct, and this can be seen through the main trends and patterns. We can see that when there is no sucrose present, the acidified potassium manganate (vii) does not decolourise after any period of time. This simply shows that none of the apparatus or chemicals being used are contaminated. When the sucrose solution was at 0.4 percent, it took the acidified potassium manganate 2 minutes 40 seconds to decolourise. Then, as the sucrose concentration increased the time taken for decolourisation to occur became shorter and shorter. However, there was one anomalous error
As can be seen from the above results and graph, as the sucrose concentration increased, the time taken for the acidified potassium manganate to decolourise decreased. This is because there are more collision between the sucrose and the active sites of the enzymes. This would show that my hypothesis was correct. I think that if I had used higher concentrations of sucrose, then I would have discovered that there is a point where the rate of reaction would level off. This is because all of the substrate has been broken down and there is not enough for it to continue reacting. The point at which the curve levels off, and the rate of reaction remains constant no matter what the concentration of the substrate is known as Vmax.
Evaluation:
I believe my experiment was a success which proved my hypothesis.
I think that if I were to repeat this experiment, there would be a number of things which I would change. Firstly, I would work with a much larger variable, so my concentrations would be much higher, maybe even working up to 100% sucrose concentration, so that the exact point of Vmax could be found for the enzyme concentration that I am working with. Also, I would change some different variables, to see how this would affect the experiment. I would change the enzyme concentration, and try and look at the Vmax for a small number of different enzyme concentrations, and also I would change the temperature to see how this affects my results.