While there are only two risks, it is imperative that the risks are minimised. Therefore, the experiment has to be conducted with utmost care, and the following guidelines have to be followed:
In order to protect the yeast, the operator will have to ensure that an excess is not used, and that only the necessary amount of yeast is used and no more. This makes sure that it is treated with respect as an organism. This also means that if it is going to be exposed to a temperature which may kill the yeast that the yeast that does die will be minimised.
As for the glass, the conductor must ensure that any broken glass is cleaned up immediately, and any cuts are healed before continuing the experiment. When the glass it broken, or chipped, the experiment must be discontinued immediately while wounds are covered and the glass is thoroughly cleaned.
The equipment that is required for this experiment has been chosen very carefully, in order for it to work to the full potential based on what was available. This equipment can be justified below:
Justification of Equipment:
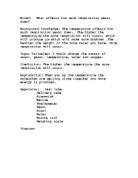
Full Equipment List:
- Safety Goggles
- Lab Coat
- 2 x 1000 cm³ Beakers
- 2 x 100 cm³ Beakers
- Conical Flask with Delivery Tube
- Bung
- Thermometer
- Stirring Rod
- Distilled Water
- Water Bath (if available. If not, hot water).
- Kettle
- Measuring Scales
- 150g Powdered Glucose
- 150g Dried Yeast
- Stopwatch
Constant Variables:
In order to produce fully reliable results, some aspects have to remain constant. As a result of this, it will ensure that the experiment is a fair and balanced test, with no interference or foreign substances damaging the investigation. The following aspects I have to keep constant throughout my experiment:
- Time used for each part of the pilot experiment. For example, in the pilot method keeping five minutes as the amount of time for measuring each temperature and the respiration the yeast gives off during this time.
- Amount of glucose used. This will ensure that the yeast receives the same amount of glucose (a necessity for respiration), and is available to be used.
- Amount of yeast used. This will ensure that the glucose has enough yeast to react with it in each experiment.
- Temperature. This does not refer to the pilot method, but actually the proper experiment itself. In the proper experiment, it is essential that the optimum temperature is kept at the same level throughout the test.
- Concentration of glucose. This will not be a factor as it is powdered glucose, but this does also imply that the operator must use the same type of glucose for each test.
- Type of yeast. While it may seem obvious, it is necessary that the yeast all comes from the same brand.
- Amount of water mixed with the glucose and yeast. With this, the dilution of glucose and yeast remains the same, so there is the same proportion of particles available to react with each other.
- pH must remain constant. While I will not be monitoring this, it must be ensured that no acidic compounds interfere with the experiment, and the pH is kept neutral.
- Size of the yeast and glucose. This means keeping similar shaped balls of yeast, and powdered glucose very fine, because surface area affects the rate of reaction, due to more frequent collisions. Therefore, if I
As well as this, there are several other aspects to keeping the experiment a fair test. The most notable of these is to ensure that all equipment is properly cleaned after each individual test has been completed. This should be done with distilled water, so that other chemicals, like fluorine, coming out from the tap water and interfering with the test. These minor changes will help the experiment be as accurate as possible.
Variables:
In this experiment, there is only one variable. For the pilot method, the only variable is the temperature of the water bath, as the time that the yeast and glucose will remain in the water bath will remain constant throughout this test. In the main experiment, the variables will be the time, as the optimum temperature will remain constant throughout. In other words, it is almost the reverse of the pilot method. The time the yeast will be exposed to its optimum temperature will change after every test, and the results will be recorded.
Pilot Method:
Before conducting the main experiment, the first thing that must be done is to find the optimum temperature of the yeast. Therefore, a prior-experiment has to take place, which will be done using a pilot method. This method is similar to that of the actual experiment, except for a few changes towards the end of the experiment. Here is the pilot method [¹]:
-
Weigh out exactly five grams of dried yeast (see Figure 3.0) inside a 100 cm³ beaker. Ensure that the weight of the beaker is ignored when weighing the yeast.
-
Weigh out exactly five grams of powdered glucose (see Figure 3.1). Once again make sure that the weight of the beaker is ignored.
- Fill one 1000 cm³ beaker with cold water up to around the 700 cm³ mark.
- Create a water bath at the desired temperature (this will vary with each experiment) in the other 1000 cm³ beaker – filling it up to about 700 cm³. Use the kettle to boil water to increase the temperature, and cold tap water to decrease it. Check with the thermometer accurately and continue to do this until you get as close as possible to the desired temperature.
- Fill the 100 cm³ measuring cylinder completely with cold water. Press your palm across the top, and invert it into the 1000 cm³ beaker filled with cold water (see Figure 3.2). Try to lose as little water as possible from the cylinder. Repeat if unsuccessful.
-
Using the second 100 cm³ measuring cylinder, take 25 cm³ from your water bath (make sure its still at the desired temperature – if not then raise or lower the temperature accordingly). With this 25 cm³, mix it with the powdered glucose, and stir quickly with the stirring rod. See Figure 3.3.
-
Put the yeast into the conical flask, before repeating step six, only substituting the glucose with yeast. See Figure 3.4.
-
Put the delivery tube of the conical flask into the 1000 cm³ beaker of cold water and have it placed inside the measuring cylinder. See Figure 3.5.
-
Put the conical flask carefully in the water bath, making sure that the conical flask doesn’t get any additional water in it, and making sure the delivery tube stays in the measuring cylinder. See Figure 3.6.
- Add the glucose to the yeast mixture and quickly put the bung on the conical flask to seal it up. Start the stopwatch immediately. See Figure 3.7.
- Make sure that the temperature of the water bath doesn’t drop by heating it with more hot water if it ever goes cooler.
-
Watch carefully how much water is lost from the top of the measuring cylinder. Record results every thirty seconds. Test this for five minutes.
- Clean equipment and repeat this for various temperatures, simply changing the temperature of the water bath.
However, as referred to earlier, there is a second method, which is the method for discovering the effect of prolonged exposure to its optimum temperature in relation to the respiration of yeast.
The results to the pilot method can be seen in the next section (page 10).
Table of Results for Pilot Method: [³]
This is the table of results that were discovered following the experiment fully. The test was conducted three times, following every step in the method, and three sets of results were obtained. Using these results, a mean average was able to be found by adding the three results and dividing this by three. All results are found to three decimal places. Here is the table of results:
As can be clearly shown, the optimum temperature that was found for the respiration of yeast was 45˚C, which obtained an average result of 16.83 cm³ of Carbon Dioxide released through respiration. The table of results suggest that, after 45˚C, the yeast begins to respire less. The results when charted every 30 seconds also suggests that, at all temperatures over 55˚C, the majority of the respiration is done in the first two minutes, which suggests the yeast is adjusting to the temperature of the water bath. What this can be interpreted as, is that the yeast dies after reaching around 55˚C.
The graph for this result can be seen on the next page. This is a scatter-diagram with a line of best fit. This line will enable people to predict the amount of Carbon Dioxide that can be released at a certain temperature, based entirely on the results above.
As the x-axis tends to ∞ after the optimum temperature, the y-axis gets lower at faster rates, which indicates that the enzymes within the yeast have become denatured at this temperature. This means that the usual active site has been altered due to ionic bonds being broken within it, meaning it no longer functions properly with the glucose, and hence making the yeast cease to respire. As the x-axis tends to 0 prior to the optimum temperature, the y-axis once again gets lower due to the “N”-shaped parabola shape, which shows that the yeast will not respire as there is not enough heat energy for successful collisions between the glucose and the oxygen particles, and the frequency of collisions will also decrease. This shows clearly that yeast works best at a specific temperature, and that the best results will come +/- 5˚C from the optimum temperature of 45˚C
Method for discovering how prolonged exposure to its optimum temperature affects the respiration of yeast:
The following method must be conducted to find the effect of exposure time to optimum temperature against the respiration of yeast. It is fairly similar to the first pilot method, but with altercations to how time and temperature is managed. Here is the method:
- Weigh out exactly five grams of dried yeast (see Figure 3.0 on page 9) inside a 100 cm³ beaker. Ensure that the weight of the beaker is ignored when weighing the yeast.
- Weigh out exactly five grams of powdered glucose (see Figure 3.1 on page 9). Once again make sure that the weight of the beaker is ignored.
- Fill one 1000 cm³ beaker with cold water up to around the 700 cm³ mark.
- Create a water bath at the optimum temperature, whatever the pilot experiment suggested it was. For the sake of this example, the optimum temperature will be taken to be 45˚C. Heat the water up with hot water from the kettle, and use the thermometer to measure this. If the temperature goes unintentionally too high, then balance it out with cold water. Get the 45˚C as close as possible.
- Fill the 100 cm³ measuring cylinder completely with cold water. Press your palm across the top, and invert it into the 1000 cm³ beaker filled with cold water (see Figure 3.2 on page 9). Try to lose as little water as possible from the cylinder. Repeat if unsuccessful.
- Using the second 100 cm³ measuring cylinder, take 25 cm³ from your water bath (make sure its still at the desired temperature – if not then raise or lower the temperature accordingly). With this 25 cm³, mix it with the powdered glucose, and stir quickly with the stirring rod. See Figure 3.3 on page 9.
- Put the yeast into the conical flask, before repeating step six, only substituting the glucose with yeast. See Figure 3.4 on page 9.
- Put the conical flask carefully in the water bath and add the glucose to the yeast mixture and quickly put the bung on the conical flask to seal it up. Start the stopwatch for the amount of time to expose the yeast to its optimum temperature. Make sure that the conical flask doesn’t get any additional water in it, and making sure the delivery tube stays outside the measuring cylinder.
- Once the time has expired, reset the stopwatch quickly. Put the delivery tube into the bottom of the inverted measuring cylinder. Restart the stopwatch immediately.
- Make sure that the temperature of the water bath doesn’t drop by heating it with more hot water if it ever goes cooler.
- Watch carefully how much water is lost from the top of the measuring cylinder. Record results every thirty seconds. Test this for ten minutes.
- Clean equipment and repeat this for various times to expose the temperature to, simply changing the time used during step 9.
Table of Results for Main Method: [4]
This is the table for results for the main method. This was all conducted using 45˚C – the suggested optimum temperature from the pilot method. Once again, these were conducted using the step-by-step method for the main experiment as shown on page 11. Also, similar to the pilot method’s table of results on page 12, this was done over three tests, with the Carbon Dioxide released results purely a mean average. All figures for the average given to four significant figures:
The table of results shows that five minutes is the amount of time yeast should be exposed to its optimum temperature for maximum respiration is 26.17cm³. This indicates immediately that the more exposure to the optimum temperature, the less Carbon Dioxide is released. The only point that doesn’t follow this trend is at zero minutes of exposure; however this is to be anticipated as the yeast has to reach the optimum temperature, and without being exposed for a few minutes prior, it needs time to reach that temperature before respiring properly.
The graph for this set of results can be seen over the next page. The scatter diagram contains a line of best fit, which is useful when needing to predict the amount of Carbon Dioxide released at a given exposure time, or estimating the amount of exposure it would need to release a certain amount of CO2.
To find out the correlation of time exposed against the amount of Carbon Dioxide released, a process known as Spearman’s Ranking can be done. This compares two variables together, showing a correlation between the two. The final ranking will always be [1 ≥ ρ ≥ −1], with +1 being perfect positive correlation, and -1 being perfect negative correlation, and 0 being no correlation. The result of this is to show just how much of a trend there is between exposure time, and the amount of Carbon Dioxide produced.
After several calculations [º] it was discovered that P (the actual Spearman’s Ranking for the experiment) was -0.8929, to four significant figures. This indicates that there is indeed a trend between the amount of time exposed to the yeast’s optimum temperature and the average Carbon Dioxide released through respiration. This figure is relatively close to -1, which is perfect negative correlation, so this shows that the investigation had a concise correlation, and wasn’t affected by any abnormalities, and that there was a general trend which is explained in the conclusion on page 14.
Conclusion:
Subsequently, main method shows that yeast respires after just five minutes of exposure, and any time after that then the rate is reduced significantly (as can be seen by the steepness of the two graphs plotted for these). Once again, this relates to the hypothesis which states “…however it should be expected that, once the yeast has been exposed to this temperature, that it shouldn’t take too long for it to respire at its maximum. Therefore, it should also be anticipated that the investigation will likely reach the highest values of Carbon Dioxide released after just a few minutes, so more than likely of ten minutes exposure or less, so the yeast has enough time to reach the temperature of the water bath...”
This seems like the most logical explanation for the graph. It would have been expected that the correlation of the graph was either negative or positive with no unique points, however this statement explains why the result at 0 minutes of exposure time was in the position it was in, as it was still adjusting to the temperature of the water bath. The five minutes result shows that the yeast had reached the temperature of the water bath, and was respiring at the highest rate right at the beginning. This would be due to the enclosed environment (due to the bung in the conical flask) meaning that no extra oxygen was available, and also that the glucose that the yeast respired with would be used up to produce Carbon Dioxide gas and water.
The general trend for the graph is that as the time exposed increases, the average Carbon Dioxide released decreases. This indicates a negative correlation, and the two graphs also display this, except for the one point a 0 minutes which was explained above. The actual strength of the negative correlation was worked out by the technique known as Spearman's Rank Correlation Coefficient, which, as stated earlier takes a number between +1 and -1 to indicate the correlation of a set of points. The final result was -0.8929, which indicates a strong negative correlation. In other words, it shows that the method in this experiment produces a set of results which is not completely random, and therefore does have scientific significance.
As the yeast was exposed to more of its optimum temperature, the respiration took place outside of the measuring cylinder, and the amount of glucose available was steadily being used to create Carbon Dioxide and water, which relates all the way back to the original equation:
C6H12O6 (aq) + 6O2 (g) → 6CO2 (g) + 6H2O (l)
As the glucose was used up, more Carbon Dioxide and water was produced, while the limited amounts of powdered glucose and oxygen were used up.
Nevertheless, the results clearly suggest that prolonged exposure to its optimum temperature decreases the respiration of yeast, and that it respires the most after just a few minutes of reaction with glucose. The results also indicate that the optimum temperature itself is somewhere around the region of 45˚C
As stated in the background information, the enzymes became denatured after prolonged exposure to certain temperature, meaning a change in active site. It was also stated that the yeast would respire with the hexose sugars, as it clearly did because many results were obtained. It was also stated in the hypothesis, that when the yeast would be exposed to the optimum temperature, it would respire most after just a few minutes, as it did, and then decrease, and that any time after this, all the oxygen particles and glucose particles would have reacted, leaving little hexose sugars remaining for the yeast to use through respiration.
Evaluation:
While the experiment had a fair bit of scientific significance, and the results suggest that prolonged exposure to its optimum temperature decreases the respiration of yeast, there were some noteworthy flaws that may slightly hinder the reliability of the experiment.
The first of these would be the use of a water bath. Throughout this experiment, the water bath was made inside a 1000 cm³ beaker of water, and was made with hot water from a kettle and cold water from a tap. While this is perfectly acceptable, since a thermometer was used, which would be fairly accurate, it did mean that during the experiment taking place that the operator would have to reheat it if it fell towards temperature of the room, which it certainly would do. This could potentially hinder the reliability of the experiment, since there may have been brief periods where the temperature was a fraction too small, and therefore this could hurt the reliability of the results. A good way of getting around this which could have proven to be much better would be the use of an electronic water bath, where it is heated at a specific temperature and maintains this throughout.
Another potential flaw of the experiment is the equipment used. Every aspect of measurement in the environment where these tests would be conducted will have apparatus error. This is where the measurements will not be 100% accurate. For example, in this experiment, it is almost impossible that the person conducting the experiment would use exactly five grams of yeast each time, as there is a slight margin of error with every piece of equipment. Similarly, it is highly unlikely that anybody outside of a professional laboratory could measure 25cm³ into a measuring cylinder. If the sufficient data for apparatus error of each individual product that was used was available, and if there was access to the “official” results to this experiment, a system known as error analysis could be done. This is where the margin for error in equipment used could be used with the results obtained from the experiment to calculate how close the official result was from the results from this test. A way of getting around the apparatus error would have been to research the exact margins of error for each individual piece of equipment, but this was not available to be found, despite constant research. This also wouldn’t have made much difference since no “official” result could be found.
This test also did not attempt to use any longer temperatures, such as ten minutes instead of five for the pilot method. These broader results would have been more accurate and show a much wider scale. Subsequently, on a similar note, the main method and pilot method both took times and temperatures, respectively, in milestones of five. This is not as accurate as, say, doing every 2 minutes for time exposed. However, due to time constraints this was never much of a possibility.
There was a bit of difficulty obtaining results, since sometimes inverting the measuring cylinder was quite difficult. As well as this, it was occasionally hard to read due to light on the measuring cylinder, so some results may be slightly obscured. It was also improbable that any results (for the Carbon Dioxide released) could be obtained that weren’t factors of 0.5, due to the size of the measuring cylinder’s separations.
All results had to be obtained to four significant figures for the average Carbon Dioxide released, simply because of the accuracy of the readings from the measuring cylinder and the fact that it had to be a factor of 0.5. It would be inappropriate to use any other scale of accuracy. This is another limitation that the experiment had, since the accuracy wasn’t to the highest level it could have been.
From a scientific standpoint, the experiment did succeed in keeping the constants the same throughout. However, one major flaw that would have truly benefited the experiment would be to see how pH would affect the respiration of yeast, by making it slightly more acidic by putting in a couple of drops of an acidic compound (possibly hydrochloric acid) and then doing the same with higher concentrations of acid, before doing similar tests with alkali’s. This would have been able to show, not just the optimum temperature for the respiration, but also the environment it would benefit from the most. On the other hand, the specification for this experiment was to investigate how prolonged exposure to the optimum temperature affects the respiration of yeast, so it is debatable how useful this would have been to the investigation.
One aspect that needs to be considered is the fact that the main experiment relied completely on the fact that the results for the pilot method were correct. If anything went wrong and the pilot method was proven to be incorrect, that would instantly abolish any reliability that the main method had. Consequently, it was essential that the test was repeated several times so that mistakes were minimised. Thankfully, the results came out the same time, which suggests that it was successful, as it would be unlikely that the same mistake was made three times – unless a vital part of the method was neglected.
Due to the fact that only one anomaly result was found, and was dealt with accordingly, the experiment will be fairly reliable, and therefore the conclusions are similarly good assumptions to make given the access to equipment available. Also, by repeating the test three times and getting similar results for each aspect (excluding the anomaly), the conclusions that were made on pages 14 and 15 are, fully justified. It should be noted that if anybody got these results that they would probably come to the same conclusion that was made.
Appendix A:
[¹]: The follow refers to the justification for each step in the pilot method. Each justification will be numbered parallel to the step that it refers to in the pilot method (for example, step one in this Appendix will justify step one in the pilot method).
- The five grams of dried yeast is used to ensure that the experiment is fair, using five grams each time. This ensures that amount of particles that could react with the glucose under the heat energy will remain relatively similar each time.
- The five grams of powdered glucose, like the dried yeast, is essential for keeping the amount of particles at similar ratios.
- This is to hold the inverted measuring cylinder later on. The fact that it is cold water is meaningless other than the fact that the operator has to put their hands into this water, so for safety reasons it must be kept cool. It should be filled up to 700cm³ since taking out the measuring cylinder will release more water into it, and this prevents it from overflowing.
- The water bath is used for altering the temperature of the yeast and the glucose within the conical flask. The fact that it needs to be followed closely by the thermometer is so that the test is as accurate as possible.
- The measuring cylinder is the instrument used to measure the amount of Carbon Dioxide that the yeast respires. It is essential not to let any water run out, as it may deceive the conductor as to how much Carbon Dioxide was actually let out.
- Stirring it into 100 cm³ of water bath sample allows the solid glucose molecules to become liquid, thus providing more movement in the particles.
- Putting it into the conical flask prepares it for the place where the reaction takes place, and it is easier to move it as a solid than as a liquid.
- This prepares the yeast for respiration, as Carbon Dioxide will run up the delivery tube and be released up the measuring cylinder, and thus the amount of Carbon Dioxide omitted can be measured.
- Putting the conical flask in the water bath prepares it instantly for when the glucose mixes with the yeast. If any other the yeast or if any water gets into the conical flask, then the whole experiment will be flawed and have to be restarted.
- This allows respiration to take place and the experiment to commence. Starting the stopwatch is essential, since this will measure the amount of time that the experiment has been happening.
- This is essential, since a drop in temperature will seriously alter the results, and defy the entire point of the experiment.
- Recording results every thirty seconds allows records of trends and patterns. Doing this for five minutes each time allows each temperature to get the same amount of time and therefore is a fair test.
- Cleaning equipment is vital so that chemicals do not interfere with various substances any earlier than needed. Repeating this for different temperatures is obviously important, since this data is needed to draw up conclusions.
Appendix B:
Note: For natural reasons, a lot of this will be similar justification to that of the pilot method, and therefore some information from Appendix A has been used again.
[²]: The follow refers to the justification for each step in the main method. Each justification will be numbered parallel to the step that it refers to in the main method (for example, step one in this Appendix will justify step one in the main method).
- The five grams of dried yeast is used to ensure that the experiment is fair, using five grams each time. This ensures that amount of particles that could react with the glucose under the heat energy will remain relatively similar each time.
- The five grams of powdered glucose, like the dried yeast, is essential for keeping the amount of particles at similar ratios.
- This is to hold the inverted measuring cylinder later on. The fact that it is cold water is meaningless other than the fact that the operator has to put their hands into this water, so for safety reasons it must be kept cool. It should be filled up to 700cm³ since taking out the measuring cylinder will release more water into it, and this prevents it from overflowing.
- Creating the water bath at the optimum temperature is the whole purpose of the experiment, as this will be used to calculate how exposure affects the respiration in yeast. It needs to be as close to the optimum temperature (in this experiment’s case: 45˚C) as possible so the results are as accurate as they possibly can be.
- The measuring cylinder is the instrument used to measure the amount of Carbon Dioxide that the yeast respires. It is essential not to let any water run out, as it may deceive the conductor as to how much Carbon Dioxide was actually let out.
- Stirring it into 100 cm³ of water bath sample allows the solid glucose molecules to become liquid, thus providing more movement in the particles.
- Putting it into the conical flask prepares it for the place where the reaction takes place, and it is easier to move it as a solid than as a liquid.
- Putting the glucose in initiates the reaction, and putting the bung on top prevents anymore unwanted atmospheric particles entering. Starting the stopwatch will time the amount of time the reaction has been taking place. By making sure the delivery tube stays outside of the measuring cylinder ensures that no Carbon Dioxide interferes while it is simply being exposed.
- Stopping and starting the stopwatch allows the ten minute reaction, while putting the delivery tube up the measuring cylinder allows the Carbon Dioxide to go up the measuring cylinder so results can be recorded.
- This is essential, since a drop in temperature will seriously alter the results, and defy the entire point of the experiment.
- Recording results every thirty seconds allows records of trends and patterns. Doing this for ten minutes each time allows each exposure time to get the same amount of time to show how much it respires and therefore is a fair test.
- Cleaning equipment is vital so that chemicals do not interfere with various substances any earlier than needed. Repeating this for different temperatures is obviously important, since this data is needed to draw up conclusions.
Appendix C:
[³]: This shows the raw data collected from the pilot method, and shows how the average amount of Carbon Dioxide released was derived.
[*] This is an anomalous result and is therefore nullified from the average, as it would interfere with the correlation and disrupt the experiment. Possible reasons why this result occurred are stated in my evaluation.
Appendix D:
[4]: This shows the raw data collected from the main method and shows how this average was found.
Appendix E:
[º]: This shows the calculations for the Spearman Ranking, which would end up helping find the correlation between the average Carbon Dioxide released and the amount of exposure time, so trends could be easily identified in the project. The following data is the calculations used to work out the Spearman Ranking. It is safe to assume this as correct, since the answer always has to be between +1 and -1.
Firstly, a table had to be devised, with the following headings:
- Carbon Dioxide Released
- Exposure Time
- Rank One (Carbon Dioxide Released)
- Rank Two (Exposure Time)
- d
- d²
Spearman’s Ranking would be worked out in terms of P, which is the actual Ranking itself, and indicates the correlation of a set of points, with +1 being a perfect positive correlation, and -1 being a perfect negative correlation. d stands for the difference, between the two ranks, taking the smallest rank from the biggest. The overall formula for working out the Ranking is:
This can be interpreted like so: N is the number of results, so in my experiment there were 7. The Sigma of d² is simply the sum of all the d² numbers, and this was then multiplied by six. The sum of d² would be too hard to work out without a table, where it is made very simple.
Substituting the values obtained into the formula gives:
P = 1 - [(6x10⁶) ÷ 7(7² - 1)]
P = 1 - [(636) ÷ 7(48)]
P = 1 – [636 ÷ 336]
P = 1 - 1.8929
P = - 0.8929
Bibliography:
Word Count:
8,182 Words