-Short-circuiting of the current supplied into the circuit, to stop any of the current being earthed insulated standard wires are used and the bare steel wire only makes contact with the crocodile clips and the water in the water bath (which is held in a glass (insulated) measuring cylinder). All of the contacts are only exposed to air, which isn’t humid enough to affect the experiment.
Fair test/reliable results:
To ensure that this experiment produces reliable results and be a fair test, any factors, which can affect the experiment, are controlled (see above) and any measurements are taking to the highest degree of accuracy possible. To help produce accurate results, the experiment is repeated twice so that an average can be produced from the three sets of results which is therefore closer to the theoretical result.
Safe test:
To ensure that this experiment could not harm anyone, I avoided touching any of the contacts while current was running through it, I also took careful care to ensure that the current was not earthed anywhere. I also used low voltages in this experiment so that if the current were to be earthed through anyone it would not cause extensive damage. Because of the potential danger of the hot water form the kettle, I took care with the hot water and handled it carefully, positioning it away from the edge of the desk so it wouldn’t fall off or tip and burn someone. Because of the fact that water and electricity was used in this experiment, I took careful care to always turn off the current after I had finished experimenting and to not spill any water.
Instructions:
- Set up the apparatus according to the diagram as above.
- Fill the kettle with tap water and turn it on, making sure that throughout the experiment it is on and full of hot water.
- Wrap the steel wire around one of the wooden splints leaving two ends on the same side. The using selotape, stick the other two wooden splints onto either side of the one with steel wire.
- Attach this to the two crocodile clips and place it into the 250-ml measuring cylinder.
- Connect up the batteries so that a current is flowing through the circuit. Turn on the multimeters and make sure they are recording the appropriate measurement (i.e. volts or amps) and that they are functioning properly.
-
Fill up the 250-ml measuring beaker with cold of water from the tap till the water bath is at 10°C, and then quickly record the volt and amp readings from the two multimeters.
-
Repeat instruction 6 but make the water temperature of the water bath 20°C, 30°C, 40°C, 50°C, 60°C, 70°C, 80°C, 90°C consecutively by adding an appropriate amount of hot water from the kettle.
- Disconnect the batteries, empty the water in the measuring beaker and pack up the rest of the equipment (*note must be done in that order).
- Using the recorded amp and volt readings calculate the appropriate resistance for each temperature using the formula R = V / I.
Results:
I am now going to display these results in the form of a line graph, so that any patterns or correlation can be made on the results. To give an idea of how accurate the results are and what range the true results should be, I have used error margins. When collecting results for this experiment the accuracy for getting the actual temperature at higher required temperatures decreases; this is because at higher temperature there is a greater temperature difference between the water bath and the surrounding area. This means that at higher temperatures the temperature of the water bath can drop quicker than at lower temperatures (where the temperature difference is less). To represent this opening for inaccuracy, I have used x-axis error bars on the results with an error amount of 5% of the value (temperature for that result). The x-axis error bars only go lower than the associated result value. This is used to represent the fact that at any temperature along the scale used in the experiment (with the exception of 10°C), the actual temperature could only be the temperature or lower due to the temperature drop effect. A 5% value is used in the x-axis error bars because it incorporates the notion that the inaccuracy goes up with a rise in temperature. Making the x-axis error bars bigger at higher temperatures and smaller at lower temperatures.
There is also the possibility of inaccuracy among the ohms readings, due to the possibility of inaccuracy in the multi-meters that were used to take volt and amp readings. To represent this opening for inaccuracy I have used y-axis error bars on the results with an error amount of 2.4 either side of the values. Unlike the x-axis error bars, the y-axis error bars go either side of the result because the inaccuracy could be both above and below the actual result. An error amount of 2.4 is used because that amount makes all the error margins go within both the linear and logarithmic treadlines of the results. The reason I chose to do this is that the results do not look very accurate; therefore it would make sense to produce treadlines, which show the results cancelling out to some effect of the inaccurate results. If some of the results are inaccurate they must have error margins that have the treadlines within them, so as to show their possible extent of inaccuracy.
The linear and logarithmic treadlines are used so as to help identify patterns in the results, which look fairly inaccurate. Both a logarithmic and linear treadlines are used because I am not sure whether the relationship between temperature and resistance is linear or logarithmic; as there isn’t a clear pattern in the results.
The average from these results are shown in graph 1, along with the treadlines and error bars discussed above.
To help conclude how accurate the results are, I have shown the separate results gained from the experiment, which make up the average used in graph 1 (i.e. results # 1, 2 and 3) in graph 2. This will show if any anomalies in any of the strands of results have affected the results out of proportion. I have also made graph 3, which shows the range of the different values obtained from #1, 2 and 3 at each temperature value. This graph will help me see how the accuracy changes with the temperature. As well as graph 3 I have produced graph 4, which shows how the standard deviation of the individual results at each temperature varies with the temperature.
Conclusion/Observations:
The results show me that the temperature is inversely proportional to the resistance, which goes against my prediction and against the theory behind this relationship. I can conclude this as although the results do not show any immediate patterns, both the linear and the logarithmic treadlines have a negative gradient (are sloping downwards). This means that I can classify the results as having a very weak negative correlation, according to these results, the higher the temperature the lower the resistance and the lower the temperature the higher the resistance. From these results I cannot identify whether the very weak correlation is logarithmic or linear, as the results do not show any distinctive patterns. However if I follow the theory behind this correlation (ignoring the fact that these results show the opposite of what the theory predicts), it tends to suggest that the relationship is linear (y=mx + c not y=nx^2 + mx +c). Therefore according to this theory, the relationship is linear, therefore according to the linear treadline the relationship is y = -0.0238x + 49.577 namely Ohms = -0.0283the temperature + 49.577. I have used the treadline as a basis for this conclusion because the results have a weak correlation, and the linear treadline is therefore nearer to the theoretical result.
However, the weakness of this negative correlation raises the notion that the results have no correlation at all. To investigate this possibility I will first try to find how just how weak this negative correlation is. As you can see from graph 2 the different result values for each temperature vary quite a lot from the average. This undermines the accuracy of the results, as the greater the range of the results from the average the less likely the results and therefore the average is accurate. The range of the different results for each temperatures and the standard deviation from the mean can indicate how accurate the results are. This is because, as I have explained earlier the range and the deviation of the results from the mean determines how accurate the results are. Graphs 3 and 4 show how the standard deviation and the range of the results change over the temperature range used in the experiment. In graph 3 the range was calculated by subtracting the lowest value from the highest, and in graph 4 the standard deviation was calculated using the formula; √((∑(x -•x)/n) (where x = the values and n = the number of values).
Graph 3 and 4 show that in general the accuracy of the result increases with an increase in the temperature, and that at low temperatures the results are not very accurate at all. I can conclude this as, the bigger the standard deviation or range the less accurate the results are. In both graphs 3 and 4 the general pattern shows high range and high standard deviation at low temperature (high inaccuracy) and low range and low standard deviation at high temperatures (low inaccuracy). This therefore contradicts my earlier theory that the inaccuracy would increase with an increase in the temperature, however it must be taken into account that the results are very inaccurate already. Because of this inaccuracy the results may have had a certain random element in them, evidence for this is in the fact that the results are very inaccurate (they have a large range and a large standard deviation), and that the inaccuracy varies a lot from it’s trend line (see graphs 3 and 4).
So in conclusion, I think that the results of this experiment were not accurate at all and not accurate enough to draw any sound conclusions that are backed with scientific theory/knowledge. In fact I think there was a certain random element in the results that contributed to the inaccuracy of the results. Because of the inaccuracy of the results, I feel that it is not a good idea to use these results as a basis for any conclusions, especially as these conclusions cannot be backed up by any scientific knowledge. Therefore with only the results I have at this moment, I have to conclude that the resistance is directly proportional to the temperature. I can conclude this because I have decided to use scientific knowledge as a basis for the answer to this correlation. I have done this because the results I have are too inaccurate to use for making any judgements on this correlation.
Evaluation:
So far I do not think this investigation has gone very well because of the very inaccurate results, however with the large amount of scientific knowledge I have been able to come to a conclusion to this investigation that has a lot of backing. My prediction was of corse correct. The reason to this inaccuracy in the results is, in my opinion due to the large amount of contacts and wiring used in this method. Some components react to temperature by changing the resistance in different ways, most components react in a directly proportional linear way, but some components like a filament lamp or diode react in a directly proportional but logarithmic way and/or only at certain voltages. It is quite likely that in the multi-meters there were some of these components that react in a logarithmic way and at certain voltages. This means that the current flowing through the circuit would be affected out of proportion by these components, therefore affecting the resistance. Although the affect of these components would have been neutralised if one multi-meter were used, it might not be neutralised if two multi-meters were used as they were in this method. The large amount of wire used in this experiment has meant the current could have been easily affected by other variables that I did not take into account, like a change in the room temperature, or if I accidentally spilt some water onto the wires. Also like the different depths used in the water bath, or a magnetic flux from the high voltage used in the kettle. Due to the large amount of outside variables that can affect the large amounts of wire used, I have to conclude that the large amounts of wire used in this method was the main cause of the inaccuracy of it’s results. I cannot estimate how accurate my results are because I have no basis on what the true values are, only that the correlation is directly proportional.
If I were to repeat this investigation, I would change the method so that less wire was used and only one multi-meter was used, I would also change the method so as to stop any of the variables mentioned in this evaluation affecting the results. If possible I would try and use a more accurate multi-meter in my experiment. A more accurate multi-meter will give me more accurate results; the reduced amount of wire to be used will reduce the effect of outside variables and make the results more reliable.
I don’t think I need to do any extra research, as I have more than enough scientific backing for any conclusions I will have to make if I repeat this investigation.
*Because of the bad results I got in this investigation, which consequently meant that I could not get a value for k, I have decided to repeat this investigation, carrying on from this one.
Prediction:
See last prediction
Apparatus:
-Tap water (used to create a water bath)
-A mains power supply (230V) (used to supply the kettle with electricity so that it could heat the water needed for the water bath.
-One 250ml-measuring beaker (used to contain the water used for the water bath)
-One digital multi-meter with an internal 9V supply (used to measure the ohms)
-Tap water (used to create a water bath)
-A kettle (used to heat the water for temperatures (for the experiment) that were above room temperature to be used in the water bath)
-A power supply (used to supply the kettle with electricity so that it could heat the water needed for the water bath.
-A -10°C to +110°C thermometer (used to monitor the temperature of the water bath)
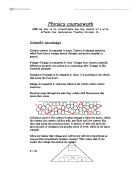
-One of these
This is basically a stick with wire highly coiled around it, I am using this instead of the last apparatus I used for simplicity and so that no extra standard wire has to be used (so it cuts down on the amount of wire in the circuit). Because there is no name for this piece of apparatus, I will refer to it here on with the name, ‘Apparatus A’.
(Apparatus A is used for measuring the effect of temperature (in the beaker) on the resistance)
Diagram:
Preliminary work:
I am using my last experiment as a basis for my preliminary work. In my preliminary work, I found that results at high temperatures needed to be recorded quickly before the temperature fell below the desired level. This is because the heat from the water bath is easily and therefore quickly dispersed to it’s surroundings, especially when the temperature difference is big. I also found that the method and apparatus used for conducting the preliminary work was not very good, because of the inaccurate results it produced. So to combat this problem I must change the method so as to make the results more accurate and reliable; the factors that contributed to the inaccuracy of the results of the preliminary experiment was;
- The large amount of wire used in the experiment
- The large amount of contacts used in the experiment
- The fact that two multi-meters were used in the experiment
Method:
Input variable – The temperature in which the current passes through the wire is the input variable, because this is the variable that we control it is therefore the independent variable.
Output variables – The ohmage (measured by the multi-meter) is the output variable, since this is a variable, which I do not control in the experiment, it is therefore a dependent variable.
Control variables – Since some variables can affect the results of the experiment out of proportion, if I control these variables it then assures that my conclusions on the relationships will be more accurate. The control variables are:
-AC or DC current, if an alternating current is used it risks damaging the multi-meter and giving inaccurate readings, to combat this problem a DC current will be used (provided by the batteries).
-Heat from other sources can easily affect the experiment because they can affect the current and therefore the voltage any place in the contacts like the wires and the multi-meter. To combat this problem, the experiment was conducted in room temperature, which means that there would not have been any significant changes at room temperatures. Heat from other sources can also directly affect the temperature of the water bath, so to combat this problem it is kept constant with the monitoring of a thermometer and consequent adding of hot (from the kettle) or cold (from the tap) water. The heat in the water bath for recordings at certain temperatures can disperse easily to it’s surroundings especially when high temperature are used. So to stop this the desired temperature in the water bath is kept constant with the monitoring of a thermometer and consequent adding of hot (from the kettle) or cold (from the tap) water.
-Short-circuiting of the current supplied into the circuit, to stop any of the current being earthed insulated standard wires are used and the bare wire used in apparatus A only makes contact with the water in the water bath (which is held in a glass (insulated) measuring cylinder). All of the contacts are only exposed to air, which isn’t humid enough to affect the experiment.
-Electromagnetic flux from the kettle affecting the current in the circuit, the kettle uses a lot of volts when heating up the water inside it, this creates a magnetic field. However the kettle uses alternating current, meaning that the magnetic field will change every 50th of a second, which creates a magnetic flux. If any of the wires come into contact with this changing magnetic field, current can be induced which is potentially dangerous. This is because it would induce an alternating current on a wire with a direct current flowing through it. This would not only change the ampage flowing through the wire (and therefore the resistance as well) but risk damaging the multi-meters. To combat this problem, I made sure that at all times the kettle was 50 cm away from all the other pieces of apparatus used in the experiment.
-Varying depths of water used in the water bath, the varying amounts of water in the water bath can come about by the necessary adding of hot or cold water to keep the water bath at the right temperature. With varying amounts of water over the wire in apparatus A, the temperature affects different lengths of wire each time therefore giving inaccurate results. To combat this the water level is maintained at 250 ml by letting some of the water out of the beaker down the sink when it gets above 250 ml.
Fair test/reliable results:
To ensure that this experiment produces reliable results and be a fair test, any factors, which can affect the experiment, are controlled (see above) and any measurements are taking to the highest degree of accuracy possible.
Safe test:
To ensure that this experiment could not harm anyone, I avoided touching any of the contacts while current was running through it, I also took careful care to ensure that the current was not earthed anywhere. I also used low voltages (9V) in this experiment so that if the current were to be earthed through anyone it would not cause extensive damage. Because of the potential danger of the hot water form the kettle, I took care with the hot water and handled it carefully, positioning it away from the edge of the desk so it wouldn’t fall off or tip and burn someone. Because of the fact that water and electricity was used in this experiment, I took careful care to always turn off the current after I had finished experimenting and to not spill any water.
Instructions:
- Set up the apparatus according to the diagram as above.
- Fill the kettle with tap water and turn it on, making sure that throughout the experiment it is on and full of hot water and that it is 50cm away from the rest of the apparatus.
- Having placed ‘apparatus A’ in the 250ml-measuring cylinder attach the wires from ‘apparatus A’ directly into the multi-meter.
- Turn on the multi-meter and make sure that it is recording the appropriate measurement (i.e. ohms) and that it is functioning properly.
-
Making sure that the 250ml measuring cylinder has always exactly 250ml of water in it by letting the appropriate amount of water out into the drain when it goes above 250ml. Adjust the temperature of the water in it so it at 20°C by adding the appropriate amount of hot water from the kettle or cold water from the tap. When the water bath is at the right temperature and has exactly 250 ml of water in it, quickly record the ohm readings from the multi-meter.
-
Repeat instruction 5 but make the water temperature of the water bath 30°C, 40°C, 50°C, 60°C, 70°C, 80°C, 90°C, 100°C consecutively by adding an appropriate amount of hot water from the kettle.
- Disconnect the multi-meter from ‘apparatus A’, empty the water in the measuring beaker and pack up the rest of the equipment (*note must be done in that order).
- Using the recorded ohm readings for each temperature calculate the ampage, bearing in mind that the voltage supplies in the circuit is always 9V (supplied by the multi-meter). Calculate the ampage using the formula: I = V / R or I = 9 / R (where I= the ampage, V = the ampage and R = the resistance).
Results:
I am now going to display these results in the form of a line graph, so that any patterns or correlations in the results can be observed. To give an idea of how accurate the results are and in what range the true results should be, I have used error margins. When collecting results for this experiment the accuracy for getting the actual temperature at higher required temperatures decreases; this is because at higher temperature there is a greater temperature difference between the water bath and the surrounding area. This means that at higher temperatures the temperature of the water bath can drop quicker than at lower temperatures (where the temperature difference is less). To represent this opening for inaccuracy, I have used x-axis error bars on the results with an error amount of 5% of the value (temperature for that result). The x-axis error bars only go lower than the associated result value. This is used to represent the fact that at any temperature along the scale used in the experiment, the actual temperature could only be the temperature or lower due to the temperature drop effect. A 5% value is used in the x-axis error bars because it incorporates the notion that the inaccuracy goes up with a rise in temperature. Making the x-axis error bars bigger at higher temperatures and smaller at lower temperatures.
There is also the possibility of slight inaccuracy among the ohms readings. To represent this opening for inaccuracy I have used y-axis error bars on the results with an error amount of 0.4 either side of the values. Unlike the x-axis error bars, the y-axis error bars go either side of the result because the inaccuracy could be both above and below the actual result. An error amount of 0.4 is used because that amount makes all the error margins go within the linear trend line of the results. If some of the results are inaccurate they must have error margins that have the treadlines within them, so as to show their possible extent of inaccuracy.
The linear treadline is used so as to help identify patterns in the results, which look very accurate already due to the clear pattern they follow. The results are shown in graph 5, along with the treadlines and error bars discussed above.
Graph 6 has been produced, it is the same graph as graph 6, but the linear trend line has been extended down to y = 0; this graph will be used so as t identify at what temperature is there no resistance.
Graph 7 has been produced; it is based on calculated ampage readings from the results (ampage vs. temperature). The trend line is extended on this graph till y = 0 so as to help identify at what temperature is there no ampage or infinity resistance.
Conclusions/Observations:
Before I start to make conclusions based on the results about the relationship between the temperature and the resistance I should first find out whether these results are accurate. This is because, as I discovered with my last set of results that were unreliable, therefore if these results are also unreliable it is not worth using them as a basis for any conclusions about the relationship.
Because these results are not based on an average and are just one set of results for the same experiment, I cannot use the last methods of range and standard deviation to give an estimate on how accurate the results are. The only way I can estimate how accurate these results are is by looking at how much they deviate from the trend line and by comparing these results to the last one.
As you can see from graph 5, the results do not deviate very much from the trend line at all, indicating a very strong correlation, especially when we compare this deviation from the trend line with the last results – graph 1. This can be further demonstrated by the fact that these sets of results have y-axis error bars of 0.4 compared to the last ones (2.4). Because of these factors I have to conclude that this set of results are really quite accurate and very reliable.
As you can see from graph 5, the results follow a clear, positive, strong correlation; because the line of results follow a straight line the relationship is therefore linear. To get as close to the true values as possible, I am using a linear treadline. I am also going to use the treadline as a basis for my conclusions on the relationship as it is the closest to the true value and therefore will be the most accurate, and will give me the most accurate value of k.
To work out the formula for the treadline I got excel to do it for me because it is more accurate, but I could have easily done it by myself using the basis of y = mx +c. All I would have needed to do was to find the gradient of the line (m) and the y-intercept (c); then substitute the values in. The formula of the treadline is y = 0.0653x + 17.258. Considering the resistance scale is on the y-axis and the temperature scale is on the x-axis, y = the resistance and x = the temperature. Therefore, the resistance = 0.0653the temperature + 17.258.
My prediction predicted that the relationship would be; resistance ∝ k*the temperature (where k = the gradient or coefficient), therefore my prediction is correct (that the relationship is linear and directly proportional). The value of k that I got from these results is 0.0653; k is the gradient (y = mx + c) of the resistance divided by the temperature. Since the gradient of any graph or results is the coefficient, then k = the temperature coefficient of resistance. The y-intercept (c) is just another variable that is in accordance to the apparatus used and the environment it is in, this variable is affected by a number of things such as the length of wire uses, the volts and amps applied and so on. The temperature coefficient varies with different metals used in the experiment, and the resistance varies with which metal used and the apparatus and it’s environment. The strict definition of the temperature coefficient of resistance (a) is the change in resistance per °C rise in temperature of a specimen of the material which has a resistance of 1 ohm at 0°C. Apart from the y = mx + c temperature coefficient based formula there is another type, which is more commonly used, it is:
RT = R0 (1 + aT) (where RT is the resistance of the coil at T°C, R0 is the resistance at 0°C, a is the temperature coefficient of resistance and T is the temperature in which the wire is in).
I do not know what metal was used in ‘apparatus A’ as the conducting wire was immersed in the water bath, but I can find out by matching my temperature coefficient of resistance with the appropriate n-type semiconductor. This will also show how accurate my results are because it will show how close to the actual value for the temperature coefficient of resistance my estimate was.
Here is a list of some of the temperature coefficients of resistance for metals.
My coefficient derived from the trend line does not match even closely the coefficients of the metals above, this means that the metal used was either not one of those listed above or the coefficient was inaccurate. I personally think it is inaccurate, because these coefficients are so small, and my results having error margins 0.4 either side of the results; there is therefore a distinct possibility that my coefficient was inaccurate. Especially since I could change the coefficient to match the metals shown above without changing it more than 0.4.
By projecting my line of best fit till it reaches the x–axis or y = 0 (see graph 6) I can calculate from the results that at -260°C there would be no resistance or in other words the object would become a superconductor. If I use the formula of R = V / I to produce the approximate ampages during the experiment, and plot a graph of ampage against the temperature (see graph 7). And then, project the line of best fit till it reaches the x–axis or y = 0, I can predict that there would be no current or infinity resistance at 380°C.
Evaluation:
I think the second investigation was very successful, making the final investigation as a whole very successful as well. My prediction was proved to be correct by the second investigation, of which showed that the results of the first investigation were inaccurate. The inaccuracy of the first investigation was due to, as I said, to some outside factors that affected the results and of which were not compensated or allowed for in the method. Where as in the second investigation, the results were very accurate because the method for the experiment took into account all these outside factors that affected the experiment and stopped them from affected the results.
The first investigation gave almost entirely anomalous results, which was due to the method, but the second investigation only had one possible anomalous result (see graph 6, 60°C value), which doesn’t deviate very much form the trend line at all. Because there was only one anomalous result in the second investigation, and it barely could be called an anomalous result because it does not deviate from the trend line by very much at all. This one anomalous result could have been due to the temperature of the water bath being slightly above or below 60°C when I took the measurement.
The first investigation gave very inaccurate results, but the second gave very accurate results, it is difficult under the circumstances to estimate exactly to what degree they were inaccurate, but the y-axis error bars does give me some idea. The y-axis error bars for the first investigation were 2.4 (high) and for the second investigation they were 0.4 (low).
However, the conclusion for my second investigation and my prediction does not take into account that the fact that the formula for resistance and temperature changes at extremely high temperatures. At high temperatures (above 150°C), the correlation starts to become non-linear; this is due to the fact that another constant (β) much smaller than the temperature coefficient of resistance is added to the equation:
RT = R0 (1 + aT) to make RT = R0 (1 + aT + βT^2).
This produces a graph that along much larger ranges than the second investigation and at much larger temperatures, the graph shows a pronounced curvature. I predicted that at 380°C there would be infinity resistance, since infinity can never be reached, and the conclusion did not take into account β, that conclusion was wrong.
My second experiment and therefore the investigation failed to take this into account. However since I was using much lower temperature to investigate the relationship, there is no way I could have known about it. Or for that reason, β is so small I would probably not have been able to detect β using the apparatus I used in my experiments. However, at these very high temperatures where β starts to have an effect, most metals are near to their melting points, so this knowledge concerning β is therefore not very useful because it make very little difference before the metal melts and it’s electrical properties change (it becomes an electrolyte).
Therefore I can conclude that this investigation went well, enabling me to make accurate conclusions about the relationship between the resistance and the temperature. It primarily told me that the resistance = a (or k) * the temperature, since the title did not specify which metal or substance the relationship would have to be based on.
If I were to do this experiment again, I would make sure it is isolated as much as possible from any factors, which could affect the experiment out of proportion. I would therefore change the method and apparatus as appropriate to make sure these factors would not affect the results. To ensure more accurate results I would use apparatus that measures the resistance to a greater degree or accuracy. My first investigation was not a fair test, but my second was a fair test because the factors, which could have affected the results, were isolated from the experiment.
I don’t think I needed to do any extra research on the subject because I clearly had easily enough to back my results up and to show why certain results were anomalous.