We can then draw a graph using the results and the first graph I have drawn (graph one) is of height of squash ball against time taken. Therefore, as we can see from the graph if a tangent is drawn we can calculate the gradient. The gradient of both sides of the parabola graph is shown on graph one.
From the graph we can that as the squash ball is thrown the height of it increases as time increases and as it reaches its peak the ball speed is expected to decrease due to forces acting on (gravity) and therefore the ball drops down again. The gradient of the graph also calculates the speed (which can be seen of the graph) of the ball because of the formula:
Distance = Speed * Time therefore Speed = Distance / Time
From these results a second graph of speed against time can also be made, which is graph two. Again from this graph we can draw tangents and then work out the gradient. Using the gradient we can also work out the acceleration due to the formula:
Acceleration = change in speed / change in time Therefore acceleration = gradient.
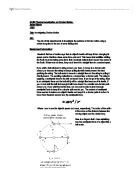
Part Two Method:
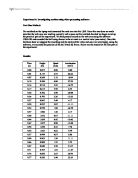
We used the same equipment for the second stage of the experiment but instead of recording the ball thrown in the air we recorded it as a projectile. To measure the displacement we used metre rules to measure horizontally as well as vertically. Below are the results from the experiment:
Results:
See next page!
From this table we can draw out a lot of information and from this I have produced a graph of horizontal displacement and vertical displacement (graph three). From the graph we can see that as horizontal displacement increases so does vertical displacement until its peak of 0.34 m. once the squash ball reaches this height it begins to fall back down due forces acting on it. After the vertical height reaches its peak it starts to decrease but the horizontal displacement continues to increase. From the graph we can also calculate the gradient, which I have done and this can be seen on the graph.
Part Three Method:
We got a step ladder and to the top of it we attached a wooden beam to it using clamps. Then we got three springs and attached them together and once this was done we attached the springs to the wooden beam using string. We then added a mass to the springs and recorded the oscillations it did using the camera. Below are the results for this:
Results:
See next page!
From the results (which is a rather long set of data) we can produce a graph and this graph is a sine wave. Within the wave, it can be seen that just about 4 oscillations have been made by the spring. The time taken for 1 oscillation is called the period T. In this case the period T for 1 oscillation is about 1.31 seconds as shown on the graph. The number of oscillations per unit time is the frequency, f = 1 / T.
Therefore, using the formula we can calculate the frequency of one oscillation, which is:
f = 1 / T
f = 1 / 1.31
f = 0.763358778
f = 0.76 Hz
Furthermore as the weights on the spring move about on a fixed point it means that the wave can be described as a single harmonic motion and the acceleration is proportional to its displacement (see graph four for more details)
Conclusion:
Therefore, in conclusion I have shown many things in this three part experiment. For each part, I have produced graphs and shown the results table that I have analysed as well. For the first part of the experiment we can see that from the graphs the squash balls speed increases as it let go from the hand and then as it reaches its peak it begins to lose its speed and comes down, which is also due to forces acting upon the graph.
Part two of the experiment is similar in respects and the difference is that it was a projectile instead. And the third part shows the spring oscillating from a ladder when a weight is attached to it. For more on these look at the graphs I have produced and the analysis beneath each part of the experiment.