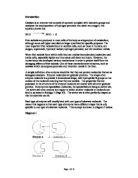
In this diagram the usual reaction is shown in (a). In (b) an inhibitor molecule fits into the active site of the enzyme. The action of the enzyme is strongly inhibited. This is because the inhibitor can bind to the same site on the enzyme but there is no reaction so no quick release of products. The inhibition is called competitive because if you increase the ratio of substrate to inhibitor in the mixture, you restore the rate of catalysis.
To find the gradient of the curve I will draw a tangent and then use the formula:
Gradient= Rise Y2-Y1
Tread X2-X1
This will help us to find out if the rate of ration is increasing or decreasing. If the gradient is negative value then y will be decreasing and x would be increasing. If the gradient of the graph is Positive value then y would be increasing and x would be increasing.
Prediction:
I predict that the greater the concentration of copper sulphate, the slower the rate of reaction because if we have greater inhibitor then substrate it becomes less likely that the substrate will collide with an empty site and the enzyme’s function is inhibited; this is competitive inhibition.
Apparatus:
- Liver
-
5cm3 Hydrogen peroxide (corrosive)
- Water bath
- Thermometer (body temperature)
- Breaker
-
Test tube (9)
- Test tube rack (for holding 9 test tube)
- Pestle
- Weight Measurer
- Mortar
-
Safety Goggles
-
Safety Gloves
- Measuring Cylinder (20mm)
- Stop watch (5 min)
- Distilled Water
- Rules
- Pencil
- Stand (3)
- Clamp(3)
- Filter paper
- Rubber Bung
- Pasteur Pipette
- Spatula(9)
- scalpel
- Tubing(9)
- Copper sulphate (0.1- 1 mole)
- Syringe
- kettle
Dependent Variable
Independent Variable
Controlled Variable
To make this a fair test you will need to focus on these things:
-
The concentration of the hydrogen peroxide(5cm3)
- Weight of the liver (about 1kg)
- Clean out the apparatus we used distilled water to get rid of any unwanted substances.
- The time you take each results, which is 5 minutes
- The temperature will stay constant (room temperature)
Substrate Concentration will affect the result; when there is an excess of enzyme molecules, an increase in the substrate concentration, produces a corresponding increase in the rate of reaction. If there are sufficient substrate molecules to occupy all of the enzymes’ active sites, the rate of reaction is unaffected by further increases in substrate concentration as the enzymes are unable to break down the greater quantity of substrate.
To control the substrate concentration, identical quantities of the substrate were used for each reading.
Safety:
To be safe you have to clean your hands after touching hydrogen peroxide as it is corrosive so gloves should be worn for extra safety. Gangway should be cleared of stools and bags to aid easy escape from the laboratory in case of emergency. If glassware is smashed, or broken, for example, by dropping on the floor, the pieces must be swept up and disposed off. Goggles should be worn for eye safety. Be careful when using the scalpel as you can hurt yourself or others.
Method:
- Measure the weight of the liver by using a electrical weight measurer
- Crush the measured liver by using a Pestle and mortar
-
Place the crushed liver in the 1st test tube
-
Place the 1st test tube with crushed liver in Water bath; water temperature must be body temperature(37o)
-
Add 1cm3 of Copper Sulphate to the beaker and then add 9cm3 of distilled water to the beaker.
-
Pour 0.1 mol of Copper sulphate in the 2nd test tube
-
Add 5cm of Hydrogen peroxide to the 2nd test tube
-
Place the 2nd test in a Water bath, remember the temperature of the water has to be body temperature
- Connect the syringe and the tubing together, when the tubing is connected to the syringe let the clamp hold the syringe.
-
Transfer 0.1 mole of copper sulphate plus hydrogen peroxide from 2nd test tube to the 1st test tube, which contain the crush liver
- Quickly connect the rubber bung, which is connected to the tubing, to the test tube.
- From the Syringe measure the gas given off, record it in a table
-
Repeat the first 12 steps, 6 times each time changing step 5 to 0.3,05,07,09 and 1 mole. To get 0.3 mole add 3cm3 of copper sulphate with 7cm3 of distilled Water and so on.
- Repeat step 1 to 13 at least three times (time dependent) so that an average can be obtained. Repeating the experiments several times will help to produce better and more accurate results, as any inaccuracies in one experiment should be compensated for by the other experiments.
- Create a table of the results, from these results, a graph can be plotted with concentration on the x-axis and the volume of gas released on the y-axis.
Preliminary Measurements:
In my preliminary work I found that as you increase the concentration of hydrogen peroxide the rate of reaction also increase this is because there is more hydrogen peroxide molecule to combine with the enzyme. In this experiment the hydrogen peroxide stays constant, the reason why I choose 5 cm3 of hydrogen peroxide is because 10 cm3 of H202 would be too much and we did not have enough liver as well so therefore 5 cm3 of H202 was reasonable amount of H202. Also the mass of the liver in my experiment stays constant, I decided to choose 1Kg; the reason for this is because in my preliminary work I found out that the more the mass of liver the greater the enzyme present and if there are more of enzyme present; then the reaction would take quite long time. Also the substrate and inhibitor would have more enzyme to combine with so the less the enzyme there are the more competition there is between the substrate and the inhibitor.
Table Results:
Conclusion
In my investigation I have found by looking at my results, that as I increase the concentration of copper sulphate (inhibitor) the rate of reaction slows down; the rate of reaction was faster when the volume of concentration of copper sulphate was low. The main reason for this is because the more the there are in a solution the harder it is for the substrate to combine with the active site of the enzyme.
We know that copper sulphate is a competitive inhibitor of the enzyme catalase. We know that catalase contains an iron haem group located in the centre. Adding copper sulphate displaces the iron from the centre of the ring. Thus, the iron which catalyses the overall reaction is removed and it cannot proceed. We don’t know if copper sulphate is either competitive reversible non-competitive irreversible, non-competitive reversible, or non-competitive irreversible.
The plotted results on the graph produce a strong negative correlation. From the line of best fit on the graph, it is clear that some of the points do not exactly fit. They are anomalies. Although they have only slight inaccuracies, they are an indicator of possible errors in the investigation. These may have occurred in either the measurement of the quantities of the enzyme and substrate or the measurement of the time taken for the manometer fluid to rise five centimetres up the manometer tube. One example of anomaly result is at 0.7 moles, this point is far away from line of best fit which indicates that this result is not correct. The reason for these anomalies results could be that, I might not have measured the mass of the liver accurateley so therefore in some liver there might be more enzymes then other and that could have affected my results. Also syringe might have been tightened and this could have given us a wrong value. I might have added the wrong amount of hydrogen peroxide or copper sulphate in the test tube, which also could have produce wrong results. It is also impossible to precisely measure out the amounts of Hydrogen Peroxide and Distilled Water each time. As the scale on the measuring cylinder shows the measurement to the nearest 1mm3, the solutions that I used should be correct to the nearest mm3. There are so many factors, which could have affected the results.
The shape of the graph is as I predicted showing that the greater the concentration of copper sulphate, the slower the rate of reaction. This is because we know that copper sulphate is and inhibitor so it compete with the substrate for the active site of the enzyme. If we have more inhibitor then the substrate then inhibitor would win the competition and combine with the enzyme active site.
Evaluation
This investigation was to discover how changes in concentration of the inhibitor affects the rate of reaction. It was found, to the satisfaction of the predictions, that the copper sulphate is a competitive inhibitor. which competes with the substrate for the enzyme’s active site. We found that the greater the ratio of copper sulphate to hydrogen peroxide the slower the rate of reaction; the reason for this is because the more the copper sulphate there is the greater the chance for copper sulphate has to combine with enzyme’s active site. To prove this you can look at the table; when the ratio of copper sulphate to hydrogen peroxide was 1:5, the syringe moved 14.8cm. When the ratio of copper sulphate to hydrogen peroxide was 9:5, the syringe moved 1.6cm back. This tells us that there was more oxygen produce when hydrogen peroxide ratio was greater then copper sulphate. This backs-up my point that copper sulphate is an inhibitor and also it is a competitive inhibitor.
To help make this experiment more accurate, I repeated this experiment three times and then used the average of all the results to plot a graph with a line of best fit. I tried to keep the experiment as fair as possible but some variables were very difficult to control such as the mass of the liver to 1kg, in reality it is impossible to keep all the variables precisely the same.
There are numerous ways to improve this experiment such as:
- It could be repeated more times to help to get rid of any anomalies results. A better overall result would be obtained by repeating the experiment more times because any errors in one experiment should he compensated for by the other experiment.
- There could be a better way to measure the amount of oxygen given off, the syringe was sometimes too tight so we could not get an accurate answer. We could have measure the mass of the of the beaker where all inhibitor substrate and enzyme all mixed up and after 5 minutes we could have measured the mass of the beaker again, to find the amount of oxygen given off we could have taken away the original mass from the new mass.
- If I was to do the experiment again I would make the experiment more accurate by:
- The accuracy to which ‘could control the surface area of potato exposed to the hydrogen, peroxide.
- Use the same tube at all time as some had different diameters
- The problem of the delay between putting in the catalyse, bunging the test tube and starting the stopwatch could have been limited by getting another person to start the stopwatch when the catalyse was putted into the test tube.
- Repeat the experiment more times
There are numbers of other further experiment we could do:
- Do the same experiment but in the end add more hydrogen peroxide to see how much amount of oxygen is given off, if more then last reading given off that means that the inhibitor is competitive reversible.
- We could find out where in enzyme does copper sulphate combine with the enzyme does it combine at the active site or elsewhere on the enzyme.
- The temperature remained constant at room temperature we could have changed the temperature see what exactly what happens
To find percentage error:
I measured the movement of the syringe to 3 significant figures. So the range can be + 0.05 or –0.05 the results. To find the percentage error we add the result or minus it by {(0.05/the result)and timing it by 100}. This is going to give us a positive percentage error and negative percentage error.
Key PE- percentage error
The range between pink and yellow line shows where the results could lie, it shows the maximum and minimum point of the results.
If you analyse the graph we can see that the line of best fit for the average is slightly in the middle of positive and negative percentage error line of best fit. Which means that the results are accurate as percentage error is not that great.