We placed 15 pieces of potato, into their own petri dishes. We then separated them into five groups, five in each group. Each group had its own weight range. The first group of potato, weighed between 0.92g and 0.98g. The second group weighed between 1.19g and 1.32g. The third group weighed 1.45g and 1.49g. We poured 5ml of different concentrations of water and sugar over the potato. These concentrations were:
- Distilled Water
- 0.05 Molar of sugar
- 0.1 Molar of sugar
- 0.5 Molar of sugar
- 1 Molar of sugar
- 2 Molar of sugar
These were then left for about 72 hours. Their new weights were then recorded and then we compared it to the old weights.
The test was made safe by making sure we use the scalpel correctly. The test was made fair by using exactly 5ml of liquid. By using the measuring cylinder, measuring the water could be done quickly and accurately. The potato was also around the same weight too.
Once all the weights have been recorded, we will take an average of the rising and falling in weights. This will then be put in a graph where there will be a line of best fit to show the pattern.
Variables
This table shows all the variables I will be changing, keeping the same and measuring:
Prediction
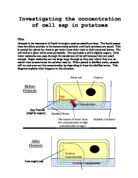
What I predict is that, the potato in the distilled water will gain in weight a lot. And the potato in the strongest solution will lose a lot of weight. I predict this because of what I have said in my introduction. The distilled water has a low concentration so more will be absorbed into the cell to even it out. And the potato in the high concentration will lose weight as water will be lost from inside the cell to even out the concentration.
This is my predicted graph:
Obtaining Results
The tests were carried out as stated above and these were the results that were recorded:
Analysing Results
The average weight changes for the concentrations are listed below:
- Distilled Water = +0.2g
- 0.05 Molar = +0.04g
- 0.1 Molar = +0.01g
- 0.5 Molar = -0.27g
- 1 Molar = -0.41g
- 2 Molar = -0.48g
On the next page I have drawn a graph showing the average results. The results weren’t perfect so there is a line of best fit.
Conclusion
The shape of my graph indicates that there must be a pattern between the weight change and the concentrations of water and sugar. It shows the more sugar in the water, the more water comes out of the cell, making it lighter. It also shows vice-versa, the more dilute the water is, the more water is being absorbed by the cell, making it heavier.
The results looked a little like my predicted graph except some of the values weren’t correct. It was the same shape and went down in almost the same gradient.
Also, by looking at my results graph, I can predict how strong the concentration is inside the potato cell before it is put under test. I predict that the average concentration of sugar inside the potato cell is about 0.07 molar.
My results conclude that in dilute water, the weight increases and in concentrated water, the weight of the potato decreases.
Evaluating
The experiment went quite well. We did have two weird weights of some potato so we did those again and got some more reliable answers. On the graph, the weights were all close to the line of best fit, except for the 0.1 molar one, we probably had some inaccurate answers or the solution we were using wasn’t exactly 0.1 molar.
My results did allow me to make a firm conclusion so therefore must be very reliable.
To make this test error-free, then the potatoes would have to be all the same weight and all have the same surface area. Also, the concentration we use would have to be exactly correct and use only 5ml. The Petri dishes could also be held in an incubator to keep the same temperature.
Another experiment to measure osmosis would be to place plants into different concentrations of sugar and water and test their leaves for any changes. This would show how far osmosis can go up the stem through different concentrations.