Catalase is one of the most potent catalysts known. The reactions it catalyses are crucial to life. Catalase catalyses conversion of Hydrogen Peroxide, a powerful and potentially harmful oxidizing agent, to water and molecular oxygen.
Catalase is able to speed up the decomposition of Hydrogen peroxide because the shape of its active site matches the shape of the Hydrogen peroxide molecule. This type of reaction where a molecule is broken down into smaller pieces is called an Anabolic Reaction. Catalase speeds up the decomposition of Hydrogen Peroxide into water and oxygen as shown in the equations below. Sources of catalase are carrots, liver, potato etc.
Catalase
Hydrogen peroxide water + oxygen
Catalase
2H2O2 2H20 + O2
Hydrogen peroxide with a chemical name of H2O2 is a colourless, syrupy liquid that is a strong oxidizing agent and, in water solution, a weak acid. Although pure hydrogen peroxide is fairly stable, it decomposes into water and oxygen when heated above about 80°C, it also decomposes in the presence of numerous catalysts. Hydrogen peroxide has many uses. It is available for household use as a 3% (by weight) water solution; it is used as a mild bleaching agent and medicinally as an antiseptic.
There are many variables that can alter the rate of reaction, and need to be kept constant.
At too high PH, the enzyme is denatured due to the loss of H+ ions. The same applies for too low a PH level, where too many H+ ions would attach to the negative regions of the enzyme, changes its shape and causing it to denature. The ph of the substrate will be measured by using litmus paper; I will try to do this for all repeats. However I will not be able to control the ph. I do not feel that there will be a lot of difference in ph but I can use a buffer solution to check it.
The higher the concentration of the enzyme, the higher the rate of reaction. With a larger number of catalase molecules, the chance of successful collisions between enzyme and substrate will be increased. In order to keep this constant, I will make sure I use the same volume of grated carrot tissue containing catalase each time I conduct the experiment. The mass of the carrot will be kept the same, but all carrots are different even if the same mass is grated.
As temperature increases, molecules move faster. In an enzyme catalysed reaction, this increases the rate at which the enzyme and substrate molecules meet and therefore the rate at which the products are formed.
To control this variable, the temperature will try to be maintained at a fairly constant level that will allow the enzyme to work effectively. I will try to achieve this by using a test-tube rack and spatula to handle the apparatus so that the heat from my hands does not affect the catalase.
The only variable I will change is the substrate concentration as this is the variable I am investigation, to see the effect of it on the enzyme catalase.
I will keep the volume of substrate the same and also the mass of the grated carrot for each experiment.
Prediction: I predict that as the substrate concentration increases, the rate of reaction will go up at a directionally proportional rate until the enzyme becomes saturated with the substrate Hydrogen Peroxide. When this saturation point is reached, then adding extra substrate will make no difference. I predict that when the concentration is increased more oxygen will be produced and therefore more oxygen will be produced per second, as more enzyme-substrate complexes will be formed, as there is more likely to be collisions between the substrate molecules and active sites
The rate steadily increases when more substrate is added because more of the active sites of the enzyme are being used which results in more reactions so the amount of oxygen released in a period of time is higher. Once the amount of substrate molecules added exceeds the number of active sites available then the rate of reaction will no longer go up. This is due to the maximum number of reactions being done at once, so any extra substrate molecules have to wait until some of the active sites become available, this is when the maximum velocity is reached.
I predict that the graph will level off as the number of active sites may be taken up thus the rate of reaction will not increase because the maximum number of reactions are being done at once, so any extra substrate molecules have to wait until some of the active sites become available, this is when the maximum velocity is reached.
I also predict that if you double the concentration of the substrate it would take half the time to get 100mm3 of oxygen gas as there are more active sites now being used up to form enzyme- substrate complexes.
Apparatus:
- Gas Burette
- 10 ml syringe
- Bung with delivery tube
- Digital stopwatch
- Thermometer
- Litmus paper
- Grated carrot
- Clamp + stand
- Tap water
- 15 test tubes
- Test tube rack
-
200cm3 beaker
-
10cm3 hydrogen peroxide of 5 concentrations.
- Digital balance
- Goggles
- Gloves
- Lab coat
- Spatula
- Small glass bottles
I have chosen the clamp and stand because it will hold the gas burette vertically. There was a choice of either a gas burette or gas syringe, I chose the gas burette because it is quite accurate but it is difficult to read the meniscus and is simple to use whereas the gas syringe is quite large. However I could have chose to use a manometer, which is just as accurate as the gas burette but is limited in how you can measure it. The bung with tube was chosen to allow gas from the test tube to be transferred without loss to the gas burette. Test tubes were chosen so that the grated carrot and hydrogen peroxide can be put into it. I will use a digital stopwatch because it is more precise than a non-digital stopwatch and that it is not possible to be precise with the non-digital stop clock. By using less precise equipment, you are more likely to get an error. The beaker was chosen so that the water in the burette is not lost as it is placed in the beaker. I will use a thermometer to check the temperature because I will need to do the experiment in room temperature therefore I will not use a water bath. I will use grated carrot as my source of catalase and not liver due to religious reasons. I will grate my carrot because I feel it is hard to get the same mass if they are sliced and also that if they are mashed then that you will lose liquid from the carrot. I will use a digital balance because it is more accurate and precise compared to a non-digital weight scale and that it is precise because it is two decimal places. I will be wearing a lab coat, goggles and gloves to protect myself any spills, as some liquids can be irritating. I will use a spatula so that the substrate is not touched as it can affect the results. I will use litmus paper to check the PH of the substrate for every experiment to make sure it is the same and I will not use a buffer because it will take up too much time.
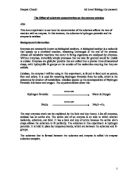
Method: Set up apparatus as shown on the next page.
- Firstly, make sure the gas burette is filled up fully, and put it in a beaker full of water, held by a stand and clamp.
- Grate the carrot, so the mass of the carrot is the same throughout the experiment. Make sure the mass is 4grams.
- Add the 4grams of grated carrot to the test tube.
- Next, add 10ml of 1% concentrated hydrogen peroxide to the test tube using a syringe.
-
Add the bung with the delivery tube on the test tube and make sure you put the delivery tube in the gas burette, and time how long it takes to collect 10cm3 O2 in the gas burette. Repeat the procedure at least another two times.
- Repeat this method also for 1.5, 2.0, 2.5 and 3.0% concentrated hydrogen peroxide solutions.
- Also, check ph levels of each experiment, by using litmus paper.
I will try to repeat each concentration at least thrice so I can get an average and make my results more reliable because by replicating observations increases the reliability of the results.
Hydrogen peroxide can be corrosive if strong, and an irritant to the skin and eyes. It should not be swallowed. It can corrode clothes and irritate the skin if not washed off thoroughly. Goggles should be worn to protect the eyes. Contact with the skin should be avoided and clothing should be protected thus by wearing a lab coat and gloves you are protecting your skin from any irritating chemical. You should also clean up any spills. The workplace should be tidy and any equipment not needed should be put away as it can get in the way. You should avoid handling, inhaling or contact with the skin wherever possible, so by using a spatula and syringe you are not touching the substrate or source of enzyme.
Analysis & Conclusion: you can see by the graphs that as I increased the concentration of hydrogen peroxide, the rate of reaction increased and as a result the time taken for 100mm3 of oxygen produced decreased. This suggests my prediction was correct as graphs B and C show. On graphs B and C it shows that the graphs didn’t level off as I had predicted and this may have happened because higher concentrations of hydrogen peroxide were not used thus the all the active sites were not being used up.
I produced an average by adding the three repetitions and divided them by three.
My results showed a clear pattern, which was that as you increased the concentration of hydrogen peroxide the time taken for oxygen to be produced decreased. I found that the average difference in time between each concentration was 57 seconds.
The reason why more oxygen was produced at higher concentrations and the time taken for it decreased was because the increased amount of substrate molecules collided more with the enzymes and therefore more enzyme- substrate complexes were formed. This is supported by my results, which show that for 1.0% concentration of hydrogen peroxide it took 258 seconds for 100mm3 of oxygen to be produced whereas for 1.5%concentration of hydrogen peroxide it took 230 seconds. This proves my prediction correct because as the concentration of hydrogen peroxide increased the time taken for 100mm3 of oxygen to be produced decreased.
Since I kept the volume of oxygen produced the same then I was able to manipulate the data and work out the rate of the reaction and amount of oxygen produced per second for each concentration. The table below shows this.
To work out the rate of reaction I used the following equation: 1/ average time x 1000.
I divided one by the average time and multiplied it by a thousand, the reason I multiplied it by a thousand was so it would be a larger number and easier to plot on a graph.
To work out the average amount of oxygen produced per second I used the following equation: 10/ average time
The reason why I divided 10 by the average time was because I was timing how long it takes for 10cm3 of oxygen to be produced.
The table shows the rate of reaction and amount of oxygen produced per second and it shows an immediate pattern. It shows that as the concentration was increased the rate of reaction increased and also that the amount of oxygen produced per second increased. Also the difference between the rates of reaction for each concentration also increases, first there is a difference of 0.4 and then a difference of 3.1 therefore you can see that my prediction was correct and can be supported by my results that as you increased the concentration of substrate, the rate of reaction and amount of oxygen produced per second also increased because when there are more substrate molecules there is more likely to be more collisions thus more enzyme-substrate complexes will be formed.
In my prediction I said that the amount of oxygen produced per second will increase as you increase the substrate concentration, and the rate of reaction will be quicker, this proves my prediction correct.
I also predicted that if you double the concentration of hydrogen peroxide that the time taken for 100mm3 of oxygen to be produced would take half the time.
As you can see in my results that for 1% concentration of hydrogen peroxide the time taken to produce 100mm3 of oxygen took an average of 258 seconds and for 2% concentration it took an average of 135 seconds to produce 100mm3 of oxygen. This shows that my prediction was correct that it took half the time when the concentration was doubled. So therefore, for 1.5% it took 230 seconds so that for 3% it should take around a 115 seconds but it took an average of 25 seconds. The reason why the time taken nearly halved for 2% concentration compared to 1% was because there was nearly double the amount of substrate molecules and that due to this more collisions would occur thus forming more enzyme-substrate molecules. I managed to get quite reliable results to prove my prediction that as you increased the concentration that the rate of reaction increased.
One of my other predictions was that the graph would level off because there is a certain point at where a saturation point is reached, and then adding extra substrate will make no difference. On all my graphs there was no levelling off. The reason why my graphs never levelled of was because higher concentrations of hydrogen peroxides were not used. The graph should level off when the active sites can only from a particular number of enzyme-substrate complexes because they are being used up and a maximum velocity has been reached. In theory the maximum rate of reaction is when all the sites are being used but in reality this theoretical maximum is never reached due to the fact that not all the active sites are being used all the time. The substrate molecules need time to join onto the enzyme and to leave it so the maximum rate achieved is always slightly below the theoretical maximum.
In general, my results were suitable enough evidence to back up my results and my prediction, that as you increased the concentration of hydrogen peroxide that the rate of reaction will increase because more enzyme-substrate complexes are being formed and the time taken for oxygen to produce decreases and more oxygen is produced per second.
Evaluation: After analysing my results I can say they were sufficient enough to back up my prediction and that the equipment I used was a good choice. Nevertheless the results can be improved and also I could improve my choice in equipment.
During my experiments it was likely that errors occurred. My main problem was that it was complicated to add the hydrogen peroxide to the test tube and then insert the rubber bung to the test tube because when the hydrogen peroxide is added to the substrate the reaction has started but only after I put the bung on was when I started the time. This will affect most of the results but as I carried out all the procedure in the same way for all the experiments it should not make any difference to the overall result however I felt this was my main source of error. The problem of the delay between pouring in the hydrogen peroxide, inserting the bung to the test tube and starting the analogue stop clock could have been limited by getting another person to start the stopwatch when the hydrogen peroxide was poured into the tube.
Another problem was that a stopwatch was not available therefore I used an analogue stop clock. This prohibited precise results. By using a digital stopwatch it would have made my results more precise. It was very difficult to read the meniscus and was hard to see the top and bottom of the meniscus. However I do not feel that it had great significance but it still may have changed the results.
As you can see from my table of results, that there was an anomalous result. For the 1.0% concentration I got the times 284, 272 and 218 seconds. This shows that the 218 seconds was an anomalous result and that the range for 1.0% concentration is 66, whereas for 1.5% concentration the range is 25, for 2.0% the range is 29, for 2.5% concentration the range is 16 and that the range for 3.0% concentration is also 16. This shows that the results for 2.5 and 3.0% concentrations are more reliable compared to the other concentration. The anomalous results could have occurred because this was my first procedure I had used and that it took me a long time to do the method, and also that the time taken to put the bung onto the tube took longer than the other experiments and I had noted this down.
To help make this experiment more accurate, I repeated all concentrations three times and then used the average of all the results to plot a graph. I tried to keep all the variables except for the concentration of Hydrogen Peroxide the same for all the experiments but I could not control the ph. However, in reality it is impossible to keep all the variables precisely the same. It is very difficult to precisely measure out the quantities of hydrogen peroxide and grated carrot. The problem for using grated carrot was that it would stick to the top of the test tubes. I could have overcome this problem by using a spatula to push the pieces of carrot down the test tube.
I feel that my results fitted a trend however the 1% concentration was not that reliable as that the range was very large. All the same, my results backed up my prediction in that as you increase concentration of hydrogen peroxide the rate of reaction increases.
My results are quite accurate because I calculated and average however I did not do a line of best fit and would consider doing it if I had to do the experiment again.
Accuracy means how close the measured value is to the true value, if I had constructed a line of best fit on my graph it would have made my results look more accurate. Also by using less precise equipment you can lead to a greater error. One of the instruments I used, which was not precise was the analogue stop clock. The reason why it is not precise is because the error will be a minimum of one second. One precise instrument I used was the digital balance. The reason why it is precise is because it is rounded off to two decimal places, therefore a minimal chance of error compared to a non-digital balance.
If I were asked to repeat this experiment again, I would definitely make some changes.
I would use higher concentration of hydrogen peroxide because in my investigation I was limited to only 5 concentrations. I would use concentrations from 1% to 10%, this is because it will make my results more accurate and it may show levelling off in graphs for the rate of reaction.
Instead of an analogue stop clock I would use a digital stopwatch because the results would be to one or more decimal places therefore making the results more accurate.
I would also use different sources for catalase such as liver or potato or yeast. By doing this I would be able to compare the amount of catalase that each source has.
Maybe having a source of catalase from yeast would have been much more easier to use and handle. Specific amounts could be measured much more precisely.
I would use a gas syringe or manometer instead of a burette because connecting the delivery tube to the burette takes a lot of time whereas by using a gas syringe, it would be set up and you would have to connect the delivery tube to the gas syringe before the experiment would start. Also by using different equipment it may give a variety of results and I would be able to compare the results and presume which instrument is more reliable and accurate.
I did not use a water bath, so if I repeated the experiment I would use a water bath to keep the temperature constant because in my experiment I was not able to control the temperature because I kept the temperature at room temperature but the temperature could have changed without my7 knowing even though it was checked at regular intervals. By using a water bath I would keep the temperature constant and therefore be controlling on of my variables. I would also use a buffer solution to keep the ph levels the same, I did not use it this time because time was a key factor and by doing this I would have lost valuable time.
I did three repetitions for each concentration to make my results more reliable by working out an average. However if I had more time I would have done more repetitions to increase the reliability of the results. If I repeated this experiment again I would do a minimum of 5 repetitions.
I measured the time taken for 100mm3 of oxygen to be produced. Instead of this I would measure how much oxygen is produced in a certain time period for example one minute. I would also increase the volume of the hydrogen peroxide because as you increase the substrate more enzyme-substrate complexes are being formed.
After evaluating my experiment I can say that my results were reliable to a certain extent and that my prediction was correct, and this was proved in my conclusion.