through the putty is doubled.
As with the length experiment, this prediction can also be
explained using the model which I have called the electricity model. This
time if you double the cross-sectional area of the putty you double the
number of paths that the electrons can take so you double the number of
electrons that can be flowing through the putty at a certain point. This
means that if you double the cross-sectional area of the putty, you double
the size of the current.
This can also be explained using another model, this time a water
model. In a series of pipes (wires), water (current) flows around the
system (circuit). If the pipes are twice as wide, double the amount of
water will pass a certain point in a certain amount of time. In the same
way, doubling the cross-sectional area of the putty will double the amount
of current flowing through it.
This prediction can also be explained on a deeper level by using
Ohm's law and rearranging formulae as before.
In the reasoning for the length variable I showed that
ρ = ((V/I) x A)/l.
The formula can be rearranged so that A= ρ x l /(V/ I). In this case,
l, ρ and V are all constants so A= I((ρ x l)/V) and so
A ∝ I.
This shows that A ∝ I. Cross-sectional area is directly proportional
to current. Doubling the cross-sectional area doubles the amount of
current flowing through the putty.
Using the formula A= I((ρ x l)/V) and knowing that the resistivity
of the putty is 40 micro ohm meters, the voltage is 3 volts and the length
is 0.05m, it is possible to predict the values I will get in my experiment.
These are as follows:
PREDICTED VALUES Resistivity, 40 micro ohm meters
Length 0.05m, Voltage, 3V
Cross-sectional area experiment
Cross-sectional area of putty(A)/m2 Current(I) / A
0.000064 0.096
0.000128 0.192
0.000192 0.288
0.000256 0.384
0.00032 0.48
0.000384 0.576
0.000448 0.672
The UNILAB values can again be used to back up these
predictions:
UNILAB VALUES Resistivity of putty, 40 micro ohm meters
Voltage, 3V
Length of putty / cm Cross-sectional area of putty(A) / cm2 Current/A Current if A=1cm2
23 2 0.064 0.032
11.7 4 0.26 0.065
11.7 1 0.064 0.064
7.2 6.1544 0.6 0.0975
You can see from the table above that all the factors are the same
except for the cross-sectional area of the putty. If you look at the figures
in italics you will see that when the cross sectional area is quartered from
4cm2 to 1cm2, the current is also quartered from 0.26A to 0.064A. This
too shows that cross-sectional area is directly proportional to current.
RELATIONSHIPS BETWEEN VARIABLES
In this experiment I would expect there to be a relationship
between the variables. As I have predicted, doubling the length of the
putty halves the current and doubling the cross-sectional area of the putty
doubles the current. If therefore the length and cross-sectional area of the
putty are both doubled at the same time, there will be no overall change
on the size of the current. This can be clearly shown by looking yet again
at the results from UNILAB:
UNILAB VALUES
Expt. Length of putty(l) / cm Cross-sectional area of putty(A) / cm2 Current(I)/A
1 23 2 0.064
2 11.7 4 0.26
3 11.7 1 0.064
4 7.2 6.1544 0.6
If you look at experiment numbers 3 and 1 you will see that when
the length of the putty is doubled from 11.7cm to 23cm, and the crosssectional
area is doubled from 1cm2 to 2cm2 the current remains the same
at 0
.
064A.
METHODS
EQUIPMENT
For the experiment I used the following items of equipment:
1. A power pack and lead.
2. An ammeter with 1A and 100mA shunts.
3. A voltmeter.
4. A rheostat.
5. Resistance putty.
6. Leads.
7. Copper plates.
8. Crocodile clips.
9. Plastic and wooden boards.
10. 5 mm and 9 mm rollers.
11. Plastic gloves.
12. A ruler.
BASIC METHOD
The basic method involved passing a current through putty with
different lengths or cross-sectional areas and measuring the size of the
current.
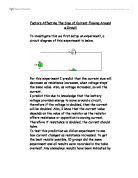
The apparatus was set up as shown in the diagram below:
The circuit was set up as shown on the previous page. The putty
was rolled out into pieces with the correct length and cross-sectional area
by placing a blob of the putty onto a plastic board and then rolling a
wooden board over the top. Once the putty was nearing the correct shape,
metal rollers with a diameter of 9mm were placed on the board so that the
putty could not be rolled out thinner than the required diameter. The putty
was then measured with the ruler and cut to the appropriate length with a
spare copper plate.
In each experiment the rheostat was adjusted so that the voltage
across the putty was 3.0V + or - 0.03V. The putty was then connected to
the circuit via copper plates connected to crocodile clips which were then
connected to the circuit. I tried to make sure that the connection between
the putty and the copper plate was as good as possible by doing the
following:
1. The copper plates were cleaned with emery paper before
they were placed against the putty.
2. I inserted the plates at right angles to the putty and gently
pushed the two pieces of putty together to try to ensure that
good contact was made without changing the shape of the
putty.
3. The plates were inserted in the same way for each
experiment to ensure the results were fair.
Depending on the size of the current flowing through the putty I
changed the shunts on the ammeter. If the current was below 100mA I
used a 100mA shunt so that the ammeter had a full scale deflection of
100mA. If the current was larger, I used a 1A shunt. I designed the
experiments so that there was never a current of more than about 0.5A
flowing as, apart from damaging the equipment, a current of that size
would have heated up the putty and since temperature is one of the
variables, the results would have been meaningless.
When I was handling the resistance putty, I wore disposable
polythene gloves as the putty tends to make a mess!!!
Each experiment was also repeated twice to try to make the results
more accurate.
DETAILED METHODS
LENGTH EXPERIMENT
Variables table. These were the variables which I tried to keep
constant:
1. The resistance of the wires etc. and the contact resistance
between the plates and the putty.
2. The cross-sectional area of the putty. (Including the amount
of contact between the plates and the putty).
3. The temperature of the putty.
4. The voltage across the putty.
This experiment was set up as described in the basic method
section. There were only a few differences. The cross-sectional area of
the putty was always kept at 9mm, as this was the diameter of the roller I
used for this experiment and this diameter of putty produced currents of
an appropriate size for the lengths of putty I was using. I varied the length
of the putty from 48cm to 2cm in intervals of 2cm by starting off with the
48cm length of putty, attaching one copper plate to one end and then
moving the other plate down the putty in 2cm intervals, adjusting the
rheostat so that the voltage across the putty remained at 3V and then
recording the current at each interval. I did the experiment twice to try
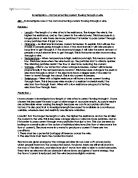
and get accurate and fair results. Below is the circuit diagram for this part
of the experiment:
CROSS-SECTIONAL AREA EXPERIMENT
Variables table. These were the variables which I tried to keep
constant:
1. The length of putty used.
2. The amount of contact between the plates and the putty.
3. The temperature of the putty.
4. The voltage across the putty.
5. The resistance of the wires etc. and the contact resistance
between the plates and the putty.
The experiment was set up as described in the basic method section
except for a few changes:
In this experiment I kept the length of the putty constant at 5cm by
accurately measuring the length with a ruler. The voltage was kept
constant at 3V. I varied the cross-sectional area by connecting similar
lengths of putty with diameters of 9mm (cross-sectional areas of
0.000064m2) together in parallel:
I started with 7 of the lengths of putty each touching the large
copper plate and recorded the size of the current. Then, one by one the
lengths of putty were removed and each time the current was recorded
and the voltage was adjusted. After all of the lengths had been removed,
seven new pieces were attached and the experiment was repeated.
MAKING THE EXPERIMENTS AS ACCURATE
AND FAIR AS POSSIBLE
There were a number of things I did to make sure that my results were as
accurate as possible; these were as follows:
1. I rolled the putty out on a board with rollers to make sure
that the putty was as near as possible to having a the same
cross-sectional area all the way along.
2. I cleaned the copper plates and inserted them into the putty
at right angles to ensure that the contact resistance was as
small as possible and that the plates were always inserted in
the same way to make sure that the experiments were fair
tests.
3. The plates were always inserted in the correct place to about
the nearest millimetre to ensure that the values for the
length of the putty are accurate.
4. For the cross-sectional area experiment, the pieces of putty
were wired in series so that I didn't have to detach the putty
every time I wanted to increase the area which would have
made the results less accurate as the putty would change
shape every time the plates were put back in.
SECONDARY DATA
Information for this experiment didn't come just from my
experiments. I also used data from reliable text books and UNILAB.
For the purpose of this investigation, I obtained values for the
properties of the putty from the "UNILAB notes for use no.48
'Experiments with resistivity putty'." The sheets gave me some sample
results and information on the putty itself.
I also obtained secondary data from my school text book "The
world of physics" by John Avison. The book also had some model results
and it explained why the results were as they were. Both sources were
very helpful.
Finally my predicted values also helped in showing me what kind
of results I was to expect and gave me a guide to the way to design my
experiment taking into account the sizes of currents being predicted.
DEFICIENCIES WITH THE DATA COLLECTION
Although I designed the experiments to be as accurate and fair as
possible, there were obviously deficiencies in the data collection methods.
Even the results published by UNILAB came up with different calculated
values for the resistivity of the putty!
One of the major problems with the experiments was that it was
very difficult to keep the temperature of the putty constant. If the
temperature is increased the resistance of the putty also increases so it is
important to keep the temperature constant. However in a school physics
classroom this was very difficult. The putty was heated up in a number of
ways: the temperature of the room had an effect, the current flowing
through the putty warmed it up and the heat from my hands while I was
getting it into the right shape also had an effect. The putty was also heated
up, although to a lesser extent, by the friction between the putty and the
rollers as the putty was being rolled out.
Contact resistance also effected the results as it could not be kept
completely constant. The distribution of the carbon inside the putty was
also likely to have had an effect.
Since these experiments only measured current for specific lengths
or cross-sectional areas of putty I cannot be sure that, for example,
doubling the length of the putty from 50cm to 1m will halve the current,
even though it is likely that it will. More tests over a wider range of
lengths or cross-sectional areas would have to be done to be even more
sure.
In all I would say that my experiments were accurate enough for
the purposes of this investigation. However I recognise that there may
well be gaps and deficiencies in the data collected and therefore more
results would be needed to ensure that my conclusions are in fact correct.
CALCULATIONS
LENGTH EXPERIMENT
To produce a value for the current flowing through a particular
length of putty I took an average of the two readings which had been
produced in my experiments.
eg. If my results were 0.020A and 0.024A The average would
be : (0.020+0.024)/2= 0.022A
CROSS-SECTIONAL AREA EXPERIMENT
To produce a value for the current flowing through a piece of putty
with a certain cross-sectional area, I took an average of the results of the
total current flowing through a number of lengths of putty with a fixed
cross-sectional area connected in parallel.
eg. If my results were 0.080A and 0.090A The average would
be : (0.080+0.090)/2= 0.085A
CONCLUSIONS
LENGTH EXPERIMENT
A Graph To Show How The Length Of The Putty Affects The Size Of The Current.
0
50
100
150
200
250
300
350
400
0 5 10 15 20 25 30 35 40 45 50
First reading Second reading
Average Predicted current
You can see from the graph above that there is a clear trend
between the length of the putty and the size of the current.
However after the putty becomes less than 10cm long, the current
readings no longer appear to be accurate. Also you will notice small
experimental errors within each reading. However there are larger errors
between the readings.
Explanation For Pattern In Results
Below is a graph showing the inverse value of the current
produced. This graph is useful as it allows you to easily compare the
relationship between length and current, as the relationship forms a
straight line on the graph.
A Graph To Compare The Length Of The Putty Between 10cm and 46cm And The
Inverse Of The Current.
0.01
0.02
0.03
0.04
0.05
0.06
0.07
0.08
0.09
0.10
10 15 20 25 30 35 40 45 50
Inverse of average Inverse 1st reading
Inverse 2nd reading Predicted inverse
If you look at the graph above you will see that there is a clear
trend between the length of the putty and the size of the inverse of the
current.
By looking at the line of best fit from the graph, we can work out
the relationship between length and current. If we take two values for the
length of the putty which lie on the line of best fit, for example the values
for when the lengths are 24cm and 42cm, we can calculate the
relationship:
Length experiment
Length of putty / cm Inverse current
24 0.032258065
42 0.063091483
0.063/0.032= 1.968
Therefore doubling the length of the putty increases the size of the
inverse of the average flow of current by a factor of 1.968. This value is
very close to the value of 2 which I predicted and within the limits of
experimental error can be considered to be 2.
Since doubling the length of the putty doubles the inverse of the
current, it follows that doubling the length of putty will halve the true
value of the current which is what I predicted earlier in the investigation.
If you look at the graphs again, you will see that the values my
experiments produced have a higher current value than the predicted
values. This means that in my experiment more current was flowing than
I had predicted.
If anything I would have expected my values to be lower due to
higher resistance caused by higher putty temperatures, contact resistance
between the metal plates and the fact that the putty might have gained a
higher resistivity due to bits of dirt, dust etc. being rolled into it.
Since the value is a lot higher for the second reading, I only have a
few suggestions for the differences:
1. The putty could have had a larger cross-sectional area than the
0.000064m2 I calculated for the second reading. This calculation was
done by squaring half of the diameter of the roller and multiplying by pie.
However it is possible that the diameter of the putty was larger than the
9mm I measured it to be. If this was the case it would mean more
electrons would be able to pass past a certain point in a certain period of
time and therefore would explain the larger current values for the second
reading.
2. Another possibility is that the ammeters and shunts which I used
for the second reading were inaccurate. I say this because my first set of
results were very close to my predicted values. However my second set
were almost twice as large. It is therefore possible that the ammeter and
shunts which I used for the second experiment were faulty and gave me
higher readings.
3. The third possibility is that the putty was substantially cooler for
the second reading leading to lower resistance. Since V=IR according to
Ohm's law, a lower resistance would produce a higher current. However
this possibility seems more unlikely as I noticed no significant
temperature changes between the two days I did the experiment.
4. It is also possible that the temperature at which I did the
experiments was actually lower than the temperature at which UNILAB
did the experiments. This would mean that my predicted values would
have been too low and so, in relative terms, there would be less resistance
in the putty in my experiments. This would mean larger currents would be
produced. The value for the resistivity of the putty which UNILAB
produced and which I used to predict some values would therefore be
different to the values my experiments produced.
In order to work out the resistivity of the putty which I used, I took
some current readings with different lengths of putty without changing
the voltage to keep it at 3V. From these values it is possible to calculate
the resistivity of the putty:
Experiment to find Cross-sectional area=0.000064m2
resistivity of putty
Voltage/V Length/cm current/mA resistance/ohms resistivity
in micro ohm meters
2.95 20 28.2 104.6099291 33.4751773
2.93 17.8 32 91.5625 32.92134831
2.92 15.8 35.5 82.25352113 33.31788198
2.9 13.9 42.5 68.23529412 31.41768938
2.88 11.7 49.8 57.8313253 31.63422922
2.85 10 58 49.13793103 31.44827586
2.78 7.9 76.5 36.33986928 29.4398941
Total= 223.6544962
Average= 31.95064231
The calculations were done as follows:
resistivity = (Voltage in volts/ current in amps x cross-sectional area of
0.000064m2)/length in m2
As you can see from the table above, the average resistivity for this
experiment was about 32 micro ohm meters which is lower than the
UNILAB value of 40 micro ohm meters. If I calculate my predicted
values again but this time use the value 32 micro ohm meters for the
resistivity of the putty, you will see that the values are much closer to the
values my experiment produced. The new values are shown at the top of
the next page:
Length experiment
Current(I) / mA Current(I) / mA Current(I) / mA Predicted current
using the value
Length of putty / cm First reading Second reading Average 32micro ohm meters
2 210 400 305 0.300
4 130 215 172.5 0.150
6 94 130 112 0.100
8 78 96 87 0.075
10 66 96 81 0.060
12 55 78 67 0.050
14 46 64 55 0.043
16 42 57 50 0.038
18 38 50 44 0.033
20 33 43 38 0.030
22 30 38 34 0.027
24 28 34 31 0.025
26 26 30 28 0.023
28 23.4 27 25 0.021
30 23 25 24 0.020
32 21.6 24 23 0.019
34 20 22 21 0.018
36 18.5 21 20 0.017
38 17.2 19 19 0.016
40 16.2 18 18 0.015
42 15.7 16 17 0.014
44 15 16 16 0.014
However you will notice that there are still some differences
between the current values I would have predicted had I known the
resistivity of the putty, and the current values my experiments produced.
These differences have to be put down to experimental errors.
If you take another look at the graph and the table, you will see that
the errors for each reading are not particularly large. It is only when you
compare the readings with each other, and the predicted values, when
large experimental errors seem to appear as although clear straight lines
are produced for each reading, the lines are by no means particularly
close together.
The best reason I have to explain why the readings are different
from one another is to say that since I didn't use the same pieces of putty
for each reading, the different lengths of putty I used for each reading
must have had significantly different amounts of resistance and so
produced different results.
Below is a list of factors which may well have caused the small
fluctuations within each set of readings:
1. Differences in the uniformity of the putty.
2. Contact resistance.
3. Inaccuracies in the measurements of length and ammeter
readings.
However perhaps the most major source of experimental error
came from changing the apparatus between readings:
I said at the beginning of this section that I would come back to the
values of the current for lengths of putty below 10cm. If you look at the
graph below which shows the inverses of both my average values and my
new predicted values you will see that the results are almost the same
below 10cm. However with lengths above 10cm when I was using a
100mA shunt on the ammeter instead of a 1A shunt in the hope that the
results would be more accurate, the results seem to have become less
accurate:
0.00
0.01
0.02
0.03
0.04
0.05
0.06
0.07
0.08
0 5 10 15 20 25 30 35 40 45 50
Average inverse Predicted inverse
This means that the different shunts would have produced different
current readings for the same length of putty with the same voltage and
cross-sectional area. This can only mean that the shunts themselves are
inaccurate and so are another source of experimental errors in my results.
As well as my results and the predicted values which were based on
the formula for resistivity, I also collected results from the UNILAB
sheets (at the back of the investigation). These also clearly show the trend
between the length of the putty and the size of the current flowing as I
explained in the predictions section of the investigation.
Conclusions
I hope by now I have thoroughly explained all the differences
between my predicted values and my results using all the data I have
obtained. I would now therefore like to go back to the UNILAB values
and the calculation I did at the start of this section and try to explain the
results scientifically using the electricity model.
I calculated that doubling the length of putty increased the inverse
current by a factor of 1.968. I concluded that within the limits of
experimental error this value could be considered to be about 2. This
meant that doubling the length of putty halved the amount of current
flowing through it. This was what I had predicted. The result can be
explained using the electricity model I mentioned in the predictions
section:
I said that the resistivity putty was made up of many many
conductive carbon atoms. Each carbon atom was surrounded by 6
electrons (4 in the outer shell) which were free to move from one carbon
atom to another. When a current is passed through the putty, electrons
from the carbon atoms move along the putty and 'bump' into the other
carbon atoms which will slow them down.
Doubling the length of the putty therefore doubled the distance one
electron had to travel. This meant that because the electrons were going to
hit twice as many carbon atoms, it would be twice as hard for the
electrons to travel from one end of the putty to the other and so it took
twice as long. This meant that the number of electrons which passed a
particular point in the circuit in a certain amount of time was halved and
since current is a measure of the rate of flow of electrons, the current
flowing around the circuit was also halved.
Final Conclusion For The Length Variable
From everything I have said and from the calculations I have done
and the graphs I have drawn in this section, I can conclude that the length
of the resistivity putty is directly proportional to the amount of
current flowing through it, provided that all other factors affecting the
size of the current remain the same.
CROSS-SECTIONAL AREA EXPERIMENT
Explanation For Patterns In The Results
A Graph To Show How Current Varies With Cross-sectional Area
0.0
0.1
0.2
0.3
0.4
0.5
0.6
0.7
0.0000 0.0001 0.0002 0.0003 0.0004 0.0005
First reading Second reading
Average Prediction
You can see from the graph above that the values for current which
my experiment produced are this time lower than my predicted values.
This is what I would have expected if the current values for the previous
part of the experiment hadn't been higher than my predicted values.
However as it is this result seems rather odd. However there are many
ways to explain it:
1. It is possible that the resistivity of the putty I used for this
experiment was higher than the 40 micro ohm meters suggested by the
UNILAB sheets. (I used a different lump of putty for this experiment than
for the length experiment). This could be because the putty was warmer
in my experiments than in the UNILAB experiments or because bits of
dirt and dust which have a high resistance had been rolled into it. The
higher resistivity would mean the values my experiment produced for the
size of the current would be lower than my predicted values.
2. It is also possible that the lower result was due to contact resistance
between the putty and the copper plates.
3. Another explanation is that the ammeter I used was inaccurate and
so the values were lower than they should have been.
4. It is also possible that the pieces of putty were a bit longer or
thinner than the 5cm and 0.000064m2 I measured them to be.
All of these errors could explain why my results were generally
lower than my predicted values, however if you look at the graph again
you will see that it is quite clear that the graph of my results is a curve.
Ohm's law states that V=IR. Since the increase in the size of current
decreases at the larger cross-sectional areas, it means that the resistance
must be increasing. The best way to explain this result is to say that the
putty got more and more squashed as I took each piece of putty away and
replaced the copper plates. Since I started with all 7 lengths of putty and
took the lengths away one by one, the last pieces to be taken away will
have been shorter and had a larger cross-sectional area than the first
pieces to have been taken away. This means that on average, less current
was flowing through each piece of putty when there were more lengths of
putty than when there were less. ie there was more resistance from the
first pieces of putty to be taken away than the last.
Conclusions
Having explained the pattern in the results and compared the
results to my predicted values, it is now possible to compare the results to
my prediction and to try to explain the pattern by using the electricity
model.
I predicted earlier that cross-sectional area was directly
proportional to the size of the current. If you take another look at the
graph you will see that I have drawn on a line marked 'line1'. This line is
a sort of 'straight line of best fit' and it can be used to calculate an
estimate of how the cross-sectional area of the putty affects the size of the
current.
Two points on the line are the points where the current is 0.19 and
0.35. From this we can calculate the gradient.
Cross-sectional area experiment
Number of lengths Current/A
2 lengths 0.19
4 lengths 0.355
Gradient = 0.355/0.19 = 1.87
This means that doubling the cross-sectional area of the putty,
increases the current by a factor of 1.87. This is slightly less than I would
have expected, but as I explained the value is an estimate since the line is
actually a curve and so the gradient decreases as the cross-sectional area
increases and the line is a sort of average. The UNILAB values and
experiments (which can be found at the back of the investigation) and the
predicted values which were calculated on the basis of the formula for
resistivity and ohm's law both show that cross-sectional area is directly
proportional to current (as explained in the predictions section). Taking
this, and the experimental errors involved in the method, into
consideration we can conclude that doubling the cross-sectional area of
putty does double the size of the current ie cross-sectional area is
directly proportional to size of current.
This is what I predicted in the predictions section, so now I am
going to explain the result using the two models: the water model and the
electricity model.
Using the electricity model it is clear that when I doubled the crosssectional
area of the putty the number of paths that the electrons could
take was also doubled so double the number of electrons were able to
flow through the putty at a certain point. Since double the number of
electrons were passing through the putty, the current was approximately
doubled
This can also be explained, as I mentioned before using a water
model. In a series of pipes (wires), water (current) flows around the
system (circuit). If the pipes are twice as wide, double the amount of
water will pass a certain point in a certain amount of time. In the same
way, doubling the cross-sectional area of the putty will double the amount
of current flowing through it.
Final Conclusion For The Cross-sectional Area Variable
From the experiment it is clear that there is a trend between the
cross-sectional area of the putty and the current which flows through it.
However, I have analysed the results from UNILAB and compared the
results to my predicted values and the models and from all the
information I can conclude that cross-sectional area is indeed directly
proportional to the size of the current.
EVALUATION
SOURCES OF EXPERIMENTAL ERROR
As I have explained throughout the conclusions section, there were
some large experimental errors in my experiments. Below is a list of the
factors I consider to have been responsible for the largest errors:
1. Inaccurate measuring equipment such as ammeters.
2. Inaccurate use of measuring instruments such as rulers
which lead to inaccuracies in the results.
3. The fact that the resistance of the pieces of putty I was using
seemed to change due to perhaps uneven distribution of the
carbon inside the putty or changes in the temperature of the
putty. The changes could be due to large currents flowing
through the putty or the putty being heated up by my
hands, friction when it was being rolled out or changes in
the temperature of the room.
4. Differences in the uniformity of the putty.
5. Contact resistance between the plates and the putty.
LIMITATIONS
This experiment was limited by a number of factors. Firstly it was
limited by the amount of time available. Although we, as a class, had
enough time to carry out enough experiments to be able to produce
accurate conclusions, we did not have enough time to carry out more
experiments on pieces of putty with particularly large cross-sectional
areas or long lengths of putty. This means that range of results is limited.
However I still believe that the data I collected was accurate enough and
covered a large enough range of cross-sections and lengths for me to have
been able to draw accurate conclusions.
FINAL CONCLUSIONS
A summary of my final conclusions for this investigation is as
follows:
1. The length of a piece of resistivity putty is inversely proportional to
the size of the current flowing through it.
2. The cross-sectional area of a length of resistivity putty is directly
proportional to the size of the current.
FUTURE EXPERIMENTS
Based on this investigation I have found that both the length and
cross-sectional area of a piece resistivity putty affects the size of the
current flowing through it. However, if I was to continue the investigation
it would be interesting to see if this is the same for all conducting
materials.