Prediction
I think when the bulb starts to get hotter the molecules in the bulb with vibrate faster, so it will be harder for the molecules to get through, therefore the resistance will increase. The resistance of the bulb at normal temperature is 6V/0.06A, which is 100 ohms, so if the filament bulb gets colder this will decrease, however if gets hotter it will be more than 100 ohms. Before doing the experiment I found out a resistor graph is a diagonal, positive straight line, when at a constant temperature, so if the temperature increases the gradient will get less steep, this is what I expect my graph to look like.
Results Table
Analysis
When the bulbs received more current the molecules in the bulb vibrated fast and the bulb became warmer as the resistance increased. As the voltage increased the current and resistance did also.
The resistance of the 6V bulb increased as the current and voltage did. However, in the pure resistor trial experiment the resistance stayed around the same as the current and voltage increased.
The difference between the bulbs and trial experiment graphs are that the bulb graph was a straight line with an increasingly deeper gradient and the other was directly proportional to the voltage. The reason the bulb graph curved is because as the bulb became hotter the molecules vibrated more, so the resistance increased. I have circled the anomalous result on the graph and found that the anomalous results in my first experiment were the same as in my check experiment. This shows that my results are reliable.
The trial experiment graph obeys Ohm’s Law because it is directly proportional but my bulb experiment doesn’t.
My conclusion supports my initial prediction as the resistance did increase and the results made a graph with a positive straight line
with a gradient which less steep.
Evaluation
I think my evidence is reliable because the anomalies in my first results were the same as the ones in my second results. The graph made a straight line with a gradient that gets deeper that is what I predicted. To improve my experiment to make it even more reliable I could use a more accurate ammeter and a larger range of results as well as more checks. The ammeter I use could be more than two decimal places, and I could get a lot of results and put them on one graph to make my results are reliable and I have a good accurate graph.
Further Work
Apparatus
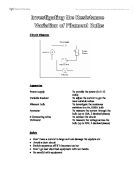
Power supply To provide the power (in 3-12 volts)
Variable Resistor To adjust the current to get the most suitable values
Filament bulb To investigate the resistance variation in a 12V, 2A bulb
Ammeter To measure the current through the bulb (up to 10A, 2 decimal places)
6 Connecting wires To connect the circuit
Voltmeter To measure the voltage across the bulb (up to 20V, 2 decimal places)
Safety
- Don’t have a current to large as it can damage the equipment
- Avoid a short circuit
- Switch apparatus off if it becomes too hot
- Don’t go near electrical equipment with wet hands
- Be careful with equipment
Fair Test
To keep this experiment a fair test I will use the same apparatus and the same bulb, because results may differ with other equipment, so by using the same I am avoiding anomalous results.
Reliability
I will do the experiment twice so I can compare the results to see if the trends are the same and avoid anomalous results.
Method
I will use the same method as my previous experiment but this time I will
be using a 2A bulb.
Prediction
I predict that when the voltage reaches 12V the resistance will reach 6
Ohms. This is because the bulb usually works at 12V and it is a 2A bulb, if you dived 12V by 2A you will get 6 ohms. Another thing I will predict is that the graph will be a curve like in my graph from the first experiment. The resistance will increase, as the bulb gets hotter like in the first experiment also. Therefore when the voltage is less than 12V the resistance will be less than 6 ohms.
Results
Analysis
When the bulb received more current the molecules in the bulb vibrated faster and the bulb became warmer as the resistance increased. As the voltage increased the current and resistance did also. The resistance of the 12V bulb increased as the current and voltage did like in the first experiment and made a curve on the graph like I predicted. I found that the results from the first experiment follow the same pattern as the ones in the second. The reason the bulb graph curved is because as the bulb became hotter the molecules vibrated more, so the resistance increased.
Evaluation
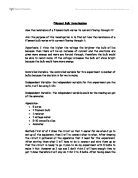
Overall I found that when you use a 12V bulb instead of a 6V one the trend is very similar. The results make up a similar graph and the resistance increases, as the bulb gets hotter. Looking at my graph I cannot see any anomalous results and think they are very reliable. To improve my experiment to make it even more reliable I could use a more accurate ammeter and a larger range of results as well as more checks.