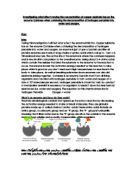
This picture shows how the enzyme is the same shape as the active site of the enzyme and is how the substrate fits into active site to form the enzyme-substrate complex. A competitive inhibitor would also be the same shape as the active site and would bind to it before the substrate does.
This diagram shows how a competitive inhibitor binds to the active site of the enzyme inhibiting the substrate from doing so. The inhibitor competes with the substrate o bind with the active site and is reversible.
This diagram shows how a non-competitive inhibitor binds to the enzyme and so changes the shape of the active sit; not allowing the substrate to bind to it and so inhibiting the catalyses of the decomposition of the substrate. This type of inhibition is irreversible.
Method
Now that we know what enzymes are, how they work and what they’re affected by we can look into how to investigate the effect of copper sulphate concentration on the enzyme Catalase when catalysing the decomposition of hydrogen peroxide into water and oxygen.
The method I will use to measure the enzyme activity is that of measuring how much of the product appears. So in this case I will be measuring the oxygen given off by the decomposition of hydrogen peroxide into water and oxygen. To make this a fair test there are certain variables that I must keep the same and the only one that differs is the concentration of the inhibitor copper (ii) sulphate. As well as this preliminary tests need to be carried out to see which vegetable or fruit has the best source of Catalase and what concentrations of the inhibitor I need to use. A control will also be carried out to prove that it is the copper (ii) sulphate that is affecting the enzymes activity and no other factors. The variables that have to be kept the same would be temperature, the source of the Catalase, the mass of the source of the Catalase, the ph at which the reaction will occur and the volume of the hydrogen peroxide. The reason why these must all be kept the same for each experiment is that they are all factors that affect the enzyme activity and because it is only the inhibitor, copper (ii) sulphate, that we are testing they must be kept the same as to demonstrate that it is none of the other factors that are affecting the enzyme activity, it is only the concentration of the inhibitor that we are changing. To keep these variables the same I will carry out the entire experiment at room temperature, the potato I use will be weighed each time to make sure the amount of potato I use for each experiment is the same, the ph will be kept the same due to the conditions for the experiment being the same throughout, I could also use universal indicator to make sure they are the same and finally and the volume of the hydrogen peroxide will be kept the same throughout the experiment by measuring it using a pipette. The concentrations I will use will be 20%, 40%, 60%, 80% and 100% (or 0 moles, 0.2 moles, 0.4 moles, 0.6 moles, 0.8 moles and 1 mole) copper (ii) sulphate. The reasons for using these concentrations are that they will provide a variety results from the enzymes activity and will hopefully show a trend when placed on a graph. For each concentration I will carry out the experiment 3 times as to eliminate any anonymous results by using the average of the 3 experiments. So overall I will be carrying out 15 experiments which will all have to be recorded in suitable tables. Here is a table of how I will make the six different concentrations.
Hypothesis
I predict that the enzyme inhibitor, copper (ii) sulphate, will slow down the decomposition of hydrogen peroxide. I also predict that as you increase the concentration of copper (ii) sulphate, the rate of the decomposition will decrease. This prediction is based on the scientific knowledge I gained about what effect enzyme inhibitors have on the catalyses of Catalase on the decomposition of hydrogen peroxide into water and oxygen.
Preliminary
Before I can do the actual experiment I need to do some preliminary tests as to see what the best source of Catalase is. To do this I will simply test a variety of different fruit and vegetables with 50cm3hydrogen peroxide and see which one bubbles the fastest. This tells me which source works best at catalysing the decomposition of hydrogen peroxide and oxygen by showing me which gives off the most gas. In the preliminary the sources of Catalase I will use will be potato, carrot and apple. To see what the best source of Catalase is I will carry out a simple experiment by placing 3 grams of each of the sources in 3 different conical flasks along with 5cm3 copper (ii) sulphate. I will then measure the amount of gas given off using a delivery tube from the conical flask to a burette placed in a water bath filled with water, this will show me how much oxygen is given off by each source of Catalase and the best source of Catalase will be the one that produces the most oxygen. This will also be the one that I use for the rest of my experiment.
Apparatus
- Potato chips of equal mass and size. The reason for this is so that the amount of enzyme remains the same throughout the experiment as the concentration or amount of substrate can affect the activity of the enzyme activity with the substrate. To make sure that I keep the amount of potato the same each time I will measure out equal quantities of the potato using the cork borer and scales, I will then crush these up using a pestle and mortar to maximise the surface area.
- Different concentrations of copper sulphate (0% 20%, 40%, 60%, 80%, and 100% or 0.0M, 0.2M, 0.4M, 0.6M, 0.8M and 1.0M copper ii sulphate). I will be using different concentrations of the enzyme inhibitor as that is what I am investigating into; the effect of varying the concentration of copper (ii) sulphate on the catalyses of the decomposition of hydrogen peroxide into water and oxygen. To make these concentrations I will use the table above and a pipette to measure out each amount of either distilled water or copper (ii) sulphate depending on which concentration I am preparing.
-
100 cm3 of 1 mole hydrogen peroxide. Hydrogen peroxide is the substrate that is being broken down in this reaction. And again the amount of substrate needs to be kept the same as it can also affect the activity of the enzyme.
- Conical flask with bung and delivery tube. This is to hold the reactants in the experiment and to deliver the products as to measure the amount of oxygen given off.
- Large water trough. This stops the water in the burette from escaping. It is also to stop any gas (product) being released.
-
50cm3 burette and clamp stand. To provide accurate measurements for the amount of oxygen being released. This is accurate to +/- 0.05
-
X2 100cm3 measuring cylinder. To measure out the amount of hydrogen peroxide to use and the different concentrations of copper (ii) sulphate.
- Cork borer. To acquire the potato chips necessary for the source of Catalase.
- Stop clock. To time the 30 second intervals as to know when to take down the recordings of oxygen produced. This isn’t a very accurate piece of equipment to use as you need to get the reading from the burette every 30 seconds so you need to take a reading a few seconds before each 30 seconds as to get a precise reading.
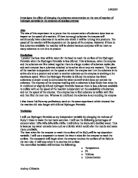
Diagram
Step by step method
- Set up the apparatus as shown in the diagram above.
- Cut 5 potato chips from a peeled potato using a cork borer. Make sure they are roughly the same size and try to make it so they all have roughly the same mass. Now use a pestle and mortar to crush the piece of potato as to maximise the surface area, maximising the surface area will increase the surface for the chemical reaction to take place on and so maximise the amount of oxygen produced by the reaction.
- Fill the burette up to the top leaving a small gap this is to make sure that you can read off the measurements down the side of the burette. Place your thumb on the end of the burette and carefully turn it upside down and place it into the trough full of water. Leave the burette submerged as to not let any water escape and hold it in place using a clamp stand.
- Place the delivery tube in the water trough and move it into position so that it is in the bottom of the burette as to make sure all the gas produced is counted for.
-
Take one of the potato chips and place it in a test tube alongside the first concentration of copper (ii) sulphate and 20cm3 hydrogen peroxide. Place the bung back that has the delivery tube connected to it on the conical flask.
- Measure the amount of gas produced by the reaction every 30 seconds by reading off from the burette, do this for 10 minutes and record your results in a table.
- Repeat this for each concentration of copper (ii) sulphate.
- Repeat steps 1-7 three times as to repeat the experiment to eliminate any anomalous results you get.
Throughout the experiment you must make sure that certain variables are kept constant. These variables are as follows; the temperature the experiment is kept at (this experiment should be carried out at room temperature), the amount of enzyme you use (e.g. the mass of the potato chip), the substrate you use (the amount of hydrogen peroxide used) and the PH of the whole experiment. The only variable that changes is the concentration of the copper (ii) sulphate.
Risk assessment
- Goggles must be worn at all times during the experiment as harmful substances such as copper (ii) sulphate may irritate eyes.
- Copper (ii) sulphate is harmful when swallowed due to fumes and dust irritates the lungs and airways. To avoid swallowing any fumes or solution keep the copper (ii) sulphate away from the face and keep it contained. It is also harmful to the skin so take great care when using the copper (ii) sulphate. Wear eye protection and clothes that cover any part of the body that may come in contact with it.
- Hydrogen peroxide can cause burns and is corrosive in high concentrations so wearing protective clothing is a necessity. When dilute it can still cause irritation to the eyes and skin. If it does get into the eye then flood the eye with water for 10 minutes and seek medical attention. If it gets on the skin and clothing then soak the clothing and flood the skin with tap water. If blistering occurs then seek medical attention.
- Take care when handling sharp or pointy objects such as the cork borer as they could penetrate the skin if not used in a suitable manor. To avoid any cuts or wound from such objects hold the object with the point facing down when moving around with it and take care when cutting the potato or other fruit or vegetables.
- When handling containers, beakers or other glass containers, be careful as not to drop them due to them shattering or spilling harmful substances such as the hydrogen peroxide or copper (ii) sulphate. If such spillages occur then inform a teacher.
Analysing results
After obtaining my results and recording them all in tables I will work out all the averages and then plot these averages on a graph. In another table I will work out the rate of reaction and then plot these results on a graph. Using the tables I will analyse how accurate my results were by comparing each repeat and how close together the values are. The closer the values are to each other, the more accurate the results are. I will also identify any anomalies and why they may have occurred using scientific knowledge about enzymes and enzyme inhibitors.
Bibliography
- Cambridge OCR Advanced sciences biology 1 pages: 40-49#
Results:
Preliminary results;
Frome these preliminary results we can see that out of the three sources of Catalase I tested the potato was the best source. So potato shall be the source that I use to carry out the experiment.
Analyses
Averages:
As you can see, the table above shows that as the concentration of copper ii sulphate increases the amount of oxygen produced decreases. However this is only true for the first four concentrations as at the 0.8M concentration the amount of oxygen produced is greater than that of the 0.6M and then the oxygen produced from the 1M concentration is then much greater than the oxygen produced from the 0.8M concentration. So due to the change in oxygen produced we can say that the values for the amount of oxygen produced in the 0.8M and 1.0M concentrations must be anomalies. The reason why the total average for the 0.8M concentration is anomalous is because the first three results make the total average anomalous.
Here is a line graph presenting the average amounts of oxygen produced:
From this graph we can see that the first four concentrations of copper (ii) sulphate produce less and less oxygen each time. This supports my prediction because as the concentration of the copper (ii) sulphate increases the amount of oxygen produced decreases. The reason for this can be explained using the scientific background in my plan; copper (ii) sulphate acts as a competitive inhibitor upon the Catalase during the catalyses of hydrogen peroxide into water and oxygen. When there is no inhibitor the amount of oxygen produced is much greater than that of when there is even a small amount of inhibitor. We can tell this from my graph; looking at the 0M concentration line we can see that the overall amount of oxygen produced is 16.3cm3 whereas the 0.2M concentration produces 5.2cm3 of oxygen. The amount of oxygen produced then carries on decreasing in the 0.4M concentration and the 0.6M concentration. However the 0.8M concentration starts off producing more oxygen than both the 0.4M and the 0.6M concentrations. On the graph it shows that the oxygen produced after 60 seconds for the 0.8M concentration is 2cm3 where the 0.6M concentration produces 1.5cm3 and the 0.4M concentration produces 1.9cm3. This tells us that the first three values for the oxygen produced from the 0.8M concentration must be anomalies. Finally the 1M concentration is out of place as it should produce less oxygen than all the other concentrations however its overall value for the amount of oxygen produced is greater than that of the 0.4M, 0.6M and 0.8M concentrations. This would imply that the results for the 1M concentration are also anomalous. All the anomalous results are highlighted in the averages table.
Each concentration on the graph starts off producing oxygen at a faster rate and then becomes slower; we can tell this due to the steepness of the graph. This slowing down of the rate of reaction occurs more rapidly in the higher concentrations due to their being more inhibitor to slow down how much oxygen is produced. The reason why the reaction starts off so quick is probably because of the plentiful supply of substrate however when the amount of substrate declines then the inhibitor has more of an effect and doesn’t have as much competition with the substrate to bind to the active site. If we let the experiment carry on for over 3 minutes we would eventually see the line for all concentrations level off due to there either being no more substrate to decompose or there being too much inhibitor and so not allowing anymore substrate to bind to the enzyme.
Here is a graph displaying the rate of reaction (amount of oxygen produced every second) for each concentration of copper (ii) sulphate.
To find the rate of reaction I divided the amount of oxygen produced for each time interval for every concentration by how long it had taken to produce that amount. I added up the answers I got for each time interval and then divided the overall value by six. Doing this gives me the amount of oxygen produced per second for each concentration of copper (ii) sulphate.
As you can see in the graph, yet again, the anomolous results appear with both the 0.8M and 1M concentrations. Due to the scientific knowledge that when increasing the concentration of a inhibitor then catalyses of the substrate by the enzyme should slow down, the graph should carry on curving downwards however it doesn’t. In fact it displays the line curving upwards at the end for the 0.8M and 1M concentrations. This is due to the anomolous results effecting the answers for the rate of reaction. We should see the curve still going downwards because the inhibitor should be inhibiting more an more enzymes at the higher concentrations, maybe even to the point where the enzyme is completely inhibited and no oxygen is produced due to the inhibitor binding to the active site of the enzyme and not the substrate.
The reason why the rate of reaction is so high for the first concentration is because there is no inhibitor for the substrate to compete with so the substrate can bind with the catalase’s active site with no bother at all, the way in which the substrate binds to the enzyme is known as the lock and key principle which is the idea that substrates have specific enzymes to bind to as the active site of each enzyme only suits one substrate, so in this case the enxyme is catalase and the substrate that is specific to this enzyme is hydrogen peroxide which breaks down into oxygen and water. There is a diagram of how this works in my plan. This means that the substrate can bind to the active site of the enzyme and be broken down into the two products at a quicker rate and more efficiently. As the concentration of the copper (ii) sulphate increases there is more competition for the substrate to compete with in binding with the active site of the enzyme for the reaction to take place. This slows the rate of reaction down as less oxygen is produced down to less of the substrate being broken down to its products due to the inhibitor binding with the active site of the enzyme. The rate of reaction carried on slowing down due to there being more and more inhibitor for the substrate (hydrogen peroxide) to compete with.
Evaluation
I believe that the suitability of my method was good as the majority of the data collected demonstrated the correct trend; the correct trend being what I predicted in my hypothesis. The method was also suitable to the conditions I was under as the data needed to be collected reasonably quickly and efficiently so I can say that although the method could be made more accurate it would not suit the conditions and time limit I was under. The anomalous results are represented as highlighted results in the table and the 2 graphs. The anomalous results I gained could have been caused by a number of things; firstly the anomalous results I had at the beginning of the 0.8M concentration could be due to left over gas in the delivery tube being pushed through into the burette making our readings higher than they should be. As for the anomalous results from the 1M concentration I’m not entirely sure why they are so far out. Some possible explanations could be; gas being leftover in the delivery tube (this would cause a decrease in the amount o gas produced), a difference in the amount of source of Catalase used (there being some potato left in the bottom of the mortar)which would make also cause a decrease in the amount of oxygen produced and so decrease the rate of reaction , measuring the wrong quantities of copper (ii) sulphate when making the different concentrations (this could both cause an increase and decreasing depending on how you go wrong when measuring it), using different equipment (i.e. previously using a delivery tube that had an air gap in it allowing some of the oxygen to escape) and maybe the source of Catalase may have differed in the way that I may have been kept warmer overnight for possible reasons such as being placed next to a radiator or the fact that we were carrying out the experiment on different days could mean that the conditions of the room could have changed (i.e. the temperature could affect the rate at which the enzyme works at as enzymes work better at higher temperatures). If the temperature conditions increased then this would cause the enzyme to work faster and more efficiently as it is at higher temperatures and so has more energy for reactions.
The limitations to which I had to work to were as follows: The size of the burette only allowed us to carry out the experiment for 3 minutes, had the burette been bigger then we would have been able to carry on the experiment longer as to see when the amount of oxygen produced levels off and to record the overall amount of oxygen produced. Another limitation was using the burette in general to measure the amount of gas produced, this is problematic because the gas has to displace the water first before we can see the measurement on the burette scale which also is inaccurate to +/-0.1cm3. This limitation would decrease the amount of oxygen produced at each time interval as not all the oxygen would have been carried through the delivery tube. As well as this the fact that gas got stuck in the delivery tube meant that as we changed concentrations, gas from the last concentration was being measured meaning that it would increase the reading for the amount of oxygen produced for the next concentration. Another problem would have been some potato getting stuck on the side of the conical flask this would decrease the amount of oxygen produced and would make it an unfair test.
To improve on the accuracy of my results there is a number of things that I could do. Firstly instead of using a burette filled with water I would use a gas syringe which measures the amount of gas without the gas having to displace the water. Doing this would avoid the problem of having gas left over in the delivery tube. This could also have been overcome by taking the apparatus apart and letting the gas escape each time, which is what I would do if I were to repeat the experiment again. Another way of improving my results would be to crush the potato into a runny paste and suck this paste into a normal syringe, this would mean that we could squirt the paste through another tube on the bung and be able to measure out precise amounts of the potato rather than having to weigh how much we use each time we would be able to squirt, for example say, 1cm3 of the source of Catalase each time. This would increase the overall amount of oxygen produced for each one as none of the gas would be able to escape at the beginning of the experiment as you do not have to take off and replace the bung of the conical flask. This would also eliminate the problem of the potato getting stuck on the sides of the conical flask as the smaller pieces would easily fit in the top of the conical flask. Another improvement would be to carry out each experiment for longer than 3 minutes as to see what the final amount of oxygen was. One final improvement I would make would be to carry out the entire experiment on the same day using the same conditions of the source of Catalase and the same conditions as to make sure it is a fair test and to reduce the amount of anomalies. This should place the results in the table closer together, so for example in the 0.4M concentration the results I got for after 3 minutes ranged from 5.3cm3 in the first set of tests to 2.5cm3 in the third set of tests which is less than half of the first result I got. This shows a big inaccuracy within the repeat experiments I did.
Overall I believe my results were reliable to the extent that they supported the idea that as the concentration of the inhibitor increases the amount of the substrate produced decreases. Al though the results supported my hypothesis I don’t think they were very reliable as for each concentration the difference in values was quite large. This would be overcome by putting in place the improvements I’ve suggested and even repeating the experiments for each concentration may improve the reliability of the results however realistically having three repeats should be enough to provide reasonably accurate and reliable results. The main source of error that would have the biggest impact would be the gas being leftover in the delivery tube as quite a lot of gas can be held in there before it escapes. Although there are many anomalous results I believe that my conclusions are valid as the results do show a trend up until the results that I believe to be anomalous. I can also say that my results are valid because other groups in the class got similar results in the way that their repeat results weren’t very close either, so we can say that it is more than likely that it was the method we used as we all used, as we all used the same method, that caused the results to be so different for each repeat. The errors that occurred do affect the accuracy of my results and could be improved upon with better equipment and a more accurate method for example using the syringe to measure the amount of potato to use each time alongside using a gas syringe instead of an upside down burette would eliminate the huge difference in values for repeat results.