Hypothesis: I predict, that as concentration increases, the weight and length of the potato chip will decrease. My reasoning behind this, is that the higher the concentration of glucose in a solution, the lower the concentration of water. When the potato chip is put into the solution, it will, by osmosis lose some of its water, and the water will diffuse into the solution of glucose, causing the potato chip to lose water, thus decreasing in weight and length.
However, if a potato chip is placed into a solution of 0 molar concentration, it should gain weight, width and length. This is because the solution has more water potential (its molecules’ ability to move) than the potato chip, and so water moves from a region of high concentration (the solution) to a region of low concentration (the potato chip.)
Predicted graphs
I predict my graphs will look like this because, in graph 1, the potato chip used for 0 molar concentration will gain water, as the water moves from a region of high concentration (the solution) to a region of low concentration (the potato chip.) This result will be an example of when the solution is Hypotonic to the potato. However, in the middle of the scale, say 0.2 molar concentration; the graph will go right down, due to the fact that the solution will be isotonic to the potato. In other words, the solution and potato chip are about equal in concentration. The reason for the minus results for 1 molar concentration is that the solution has a lower concentration of water to that of the potato, and so, by osmosis water moves from the potato to the solution, causing the weight to decrease.
Graph 2 shows the average change in length. Basically, the pattern is the same as average weight loss in graph 1. It shows how osmosis is affected by different concentrations.
Method After having done our preliminary work, we knew exactly which measurements we needed to use in order to obtain the correct sort of results. We set up 14 test tubes, because in order to save time, we intended on doing repeats at the same time as the original experiments were going on.
For organisation’s sake, we set up all of the test tubes at once, and labelled them individually to avoid confusion later on. Into each test tube, we poured 15mls of Glucose solution, and added one of the potato chips, each weighing around 1 gram, and measuring 33mm by 5mm. In order to make it as much of a fair test as possible, we added the potato chips very quickly, to make sure one chip didn’t have a longer amount of time in the solution than another. We then left each one for 30 minutes.
After 30 minutes, we emptied each test tube, leaving only the potato chips inside. Before we measured and weighed each chip, we dabbed them with paper towel. If we had of left excess water on the chips, the weights would not be accurate. We then measured the chips in mms because they are a more accurate measurement.
Results
Analysis Of Graphs:
· Graph 1 ‘Average change in width’ shows me that the higher the concentration, the more width the potato chip will lose. For example, the potato chip to gain most width was the one in pure water, or 0 molar concentration. In this test, the solution at 0 molar was hypertonic to the potato chip. The results I collected for 0.15 molar and 0.2 molar were the same. This shows me that the difference in the amount of osmosis occurring between these two concentrations is not extensive. When I used 1 molar concentration, the width actually went down. This is positive evidence that the solution was hypotonic to the potato chip.
· Graph 2 ‘Average change in length’ shows very much the same as Graph 1. As concentration increases, the length decreases. In this graph, I had many negative results. This shows that length is very strongly affected by osmosis.
· Graph 3 ‘Average change in weight’ is quite confusing. For example, the result I obtained for 0.1 molar concentration does not follow the pattern of the other results. It is not possible that the weight could have gone up more for 0.1 molar concentration, compared to 0 molar. This could be due to having excess water on the potato chip when weighing or because of misreading the scales.
Conclusion: To conclude this AT1, I can say that the movement of water through a selectively permeable membrane is affected by concentration of glucose solution, or by any other solution. The higher the concentration of glucose solution, the more the potato chip will lose its weight, width and length.
Because water molecules have kinetic energy, they are constantly moving around in gaseous or liquid form, moving randomly from one place or another. The greater the concentration of water molecules in a system or solution, the greater the total kinetic energy, and the higher its water potential. This means, that as the concentration of glucose increases in a solution, the concentration of water decreases, lessening the solution’s water potential, and lessening its ability to move between solutions by osmosis. Relating this to the potato chips: basically, as the concentration of glucose in each solution increases, the water in that solution is less able to move to the potato, causing water from the potato to move to the solution, decreasing its length, weight and width.
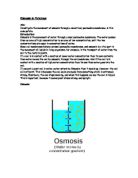
An Osmotic system is established when a semi-permeable membrane is placed beween two solutions. In biological systems osmosis is the exchange of water between the toplasm and the surrounding medium, with the plasm membrane being the semi- permeable membrane.
In the living cell, both the cell wall and plasma membrane determine the permeability of the cell, but the latter of the two is the least permeable of the two. The ability of a substance to pass through these barriers is known as the permeation of the substance. Since not all substances may pass into or out of the cell, the cell surface is known as selectively permeable or as a semi permeable membrane. The semi permeability varies from cell to cell and under certain conditions. Water molecules alone permeate freely, but ions do so more slowly, many large molecules and nonelectrolytes, such as sugars, do not move at all. This indicates that temperature could also affect osmosis. A solution in which the concentration of salt is greater than that inside the cell is called a Hypertonic solution and will cause a cell to become plasmolyzed. An example of this in my results is the test at 1 molar. In other words, it becomes dehydrated and loses water through plasmolysis. If the concentration of the salt solution (in our case Glucose solution) outside the cell is less than that inside the cell, this means that the solution is Hypotonic to the cells of the potato chip. The water will diffuse into the cells, making it turgid. This would explain why potato chips put into a solution of 0 molar seemed very firm compared to the potato chip used for 1 molar, this was because the cells of the potato had lost their turgor, and had become flaccid.
Evaluation: when it came to accuracy during this AT1, it was extremely difficult to maintain. For example, we had to, for as much as possible, keep each potato chip the same surface area, and weight. However, putting this theory into practice wasn’t easy. Even if you cut three potato chips, each measuring 33mm x 5mm, it was very unlikely that they would all weigh the same amount. This inaccuracy was due to human error, it is very difficult to make the 16 potato chips exactly the same. In future, I would make a template, or use a cutter to make all my potato chips the same.
When weighing the potato chips after 30 minutes in solutions, it was inevitable that they would have excess water on them, and so we dabbed them with paper towel to remove it. However, in doing this we could have removed water that was not excess, and altered our results.
Another inaccuracy was when we put the potato chips into the solutions, because it was impossible to not leave a small interval between each test tube. The first test would have been going for a few seconds longer than the last. I do not know how I would resolve this problem.
I also found 2 anamalous results. The first, was on the graph which showed average change in width, the anamalous result was for the test for 0.2 molar solution. The second was on the graph that showed average change in weight, the anamalous result was for the test with 0.1 molar concentration. The main reason for this is inaccuracy. I used the mean when plotting my graphs. That way, the information is clear and can be understood quickly, however, the disadvantage of this, is the fact that if one of the two results is inaccurate, the mean will also be. I believe that this is the reason for the anamalous results.
I could extend this AT1 by investigating osmosis with a different factor as opposed to concentration of water. I could investigate the effects of temperature on osmosis, or surface area. This would give me a very clear understanding and knowledge of osmosis in potatoes.