Apparatus
- Gas syringe
- Large beaker
- Test tubes
- Thermometer
- Water and ice
-
Bunsen Burner
- Gauze
- Tripod
- Heatproof mat
- Retort stands
- Boss head clamps
-
100 cm3 yeast culture
- 3 g glucose
- 2 g dried yeast
- 1 g yeast extract
-
100 cm3 distilled water
Method
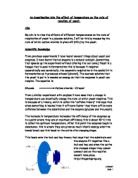
- The apparatus was set up as shown in Fig 2.
-
10 cm3 of the yeast solution was added to the test tubes.
-
They were placed in the water baths of temperatures 0 oC, 15 oC, 30 oC, 45 oC and 60 oC, and the timer was started.
-
Every 30 seconds, the volume of CO2 in the gas syringe was recorded.
- The experiment continued for 20 minutes.
- The results were recorded in Tables 2-6.
Fig 2.
Results
Table 1.
Temperature: 0 oC
Table 2.
Temperature: 15 oC
Table 3.
Temperature: 30 oC
Table 4.
Temperature: 45 oC
Table 5.
Temperature: 60 oC
Table 6.
Table 7.
Observations
For the 45 oC experiment, because the gas syringe could hold only 100 cm3 of gas, when the volume released reached 100 cm3, the sliding part of the syringe had to be pushed back to its original position. This involved taking the bung out of the beaker, so that the carbon dioxide could be released. This meant that the readings that were taken around this point are liable to be inaccurate. Another observation made was that the gas syringe moved easier when near the beginning of the outer casing. This means that when the syringe was pushed back to the beginning of the outer casing, it moved faster and less jerkily than it had whilst at the end of the outer casing. This could have affected the results for this experiment.
Analysis of and conclusions from results obtained
The first table, Table 1, shows the starting volumes of the gas syringes, for each of the experiments. This volume has been subtracted from the readings taken from the gas syringe, to give the volume of carbon dioxide given off, which is shown in the subsequent tables. The results from all the parts of the experiment are shown in Tables 2-6. Table 2 shows the results from the experiment using 0 oC as the temperature that the reaction took place at. There was no carbon dioxide released whatsoever during this experiment, as can be seen from the table. This shows us that at 0 oC, there is no cell respiration taking place, and so no carbon dioxide is being produced. No cell respiration is taking place because the temperature is too low for the cells to be able to be active, so no energy is used, or needed. This result supports the prediction that at ‘0 oC, there will be no CO2 produced’. Table 3 shows the results from the 15 oC experiment. The start volume was 1 cm3, and no carbon dioxide was released during this experiment either, which can be seen by the volume of CO2 released. There was also no cell respiration taking place at this temperature, again because of the low temperatures, meaning that no activity is taking place, and so no energy from respiration is needed. This supports the prediction that ‘at 15 oC, there will be no carbon dioxide produced’.
The experiment using 30 oC as the temperature at which the reaction took place, produced carbon dioxide, and the results can be seen in Table 4. The start volume was 1 cm3, and so subtracting 1 from all the readings has found the volume of CO2 produced. Because carbon dioxide was released during this experiment, we can say that cell respiration was taking place, because the temperature was warm enough to give the yeast molecules enough energy to move around, and therefore have the need to produce energy to do so. The carbon dioxide was produced quickly at first, and towards the end of the experiment, the rate of production of carbon dioxide slowed. This is because the glucose in the solution was becoming used up, so CO2 was produced while the glucose was readily available, but as it became more scarce, the production of energy became less, and so the release of carbon dioxide was less. If the temperature had been higher, the yeast molecules would have more energy, and so they would have continued to collide with the glucose molecules, and would have been able to use the glucose the respire with. The total amount of carbon dioxide that was produced in this part of the experiment was 27 cm3 of CO2. The results at this temperature support the prediction made that ‘there will be some production of CO2 at 30 oC’.
Table 5 shows the results from the experiment using 45 oC as the temperature at which the reaction took place. There was an initial volume of 4 cm3 in the gas syringe, and so 4 has been subtracted from all the readings to give the volume of CO2 given off. The carbon dioxide was produced quickly at the start of the experiment, again, and towards the end, the rate of CO2 production had slowed. The total volume of carbon dioxide that was given off in the 45 oC experiment was 154 cm3. There are several predictions that the results from this experiment support. Firstly, it proves that our prediction that ‘a great amount of CO2 will be produced at 45 oC’, but also that ‘when the temperature is 45 oC, the volume of CO2 produced would be at its greatest’. Because this temperature is higher than the 30 oC experiment, the molecules had enough energy to continue colliding with the glucose molecules even after they were becoming scarcer. This is why the release of carbon dioxide did not level off after a while, like the 30 oC experiment did.
The results from the 60 oC experiment have been recorded in Table 6. For the 60 oC experiment, the initial reading on the gas syringe was 4 cm3, and this was subtracted also; carbon dioxide was produced in this experiment, as can be seen in the table. The total amount of carbon dioxide that was produced in the 60 oC experiment was 53 cm3. The release of carbon dioxide stopped after 300 seconds. This is because the temperature is too high for the yeast cells to work as normal, and so they become denatured, so that the enzymes involved in fermentation cannot fit into the active site areas that they usually fit into, to break down the sucrose molecules. This explains why the release of carbon dioxide ceased after 5 minutes.
Table 7 shows the gradients of the graphs of the results that were obtained by other groups doing the same experiment. This has been done so that the results from this particular experiment can be compared and supported by other results, adding to the accuracy of the results of the experiment. The gradients of the graphs of results only have been recorded, because to have tables and to plot graphs of each of the other four groups’ results would be unnecessarily time consuming. Instead, the gradients have been pooled, and we will compare those gradients to those that our graphs of results produce. This will add a greater degree of validity to the results, because we will be able to determine whether those results that the other groups obtained support the results that we obtained.
Analysis of and conclusions from the graphs
The results that have been plotted on Graphs 1-5 have the readings on the gas syringe plotted. This is because, for some of the experiments, there was no CO2 released, and so it is easier to plot the reading on the syringe, because it is actually plottable i.e. it would be difficult to draw a graph when all the point lie on the x-axis, and do not move off it. The actual volume of gas given off can be found by subtracting the initial volumes of gas in the syringe, shown in Table 1, from each point plotted. The gradients produced will be the same, regardless of the points plotted, whether the initial volume of gas has been subtracted or not. Gradients have been worked out, and these gradients are the volume of gas given off per second. The 30 oC graph produced a curve, and so the gradient it was worked out at point (70,4.5) using a capillary tube to determine the angle at which the tangent to the curve should be drawn. The gradient of the 45 oC graph was worked out from the straight line that was plotted for the line of best fit through the points up to 10 cm3.
Graph 1 shows the results from the 0 oC experiment. The line that is produced is horizontal, and therefore does not have any gradient. Therefore, the graph plotted from the results from the 0 oC experiment support the prediction that ‘the gradient of the graph plotted will be zero’. The gradient is zero because there was no carbon dioxide released at all. Graph 2 shows the results from the 15 oC experiment. The graph is also horizontal, because no carbon dioxide was released, and so the gradient is zero. Graph 3 shows the results of the 30 oC experiment. The graph has a smooth curve through the points, and this shows that the volume of carbon dioxide given off at the start of the experiment was greater than that given off at the end. This supports the prediction that ‘the rate of release of CO2 will be quick at the start of the experiment, and will slow down towards the end of the experiment’. The gradient of the graph of the results from the 30 0oC experiment is 0.05. This means that 0.05 cm3 of carbon dioxide was given off per second for the 30 oC experiment.
The results from the 45 oC experiment are shown on Graph 4. Between ten and fifteen minutes, there is a ‘dip’ in the points plotted. This is because the volume of CO2 collected was approaching 100 cm3, and so the syringe needed to be pushed back to its original position in the syringe. This means that the readings around this point are very likely to be inaccurate. This experiment needed really to only be continued until the volume collected reached 100 cm3, and so, because of this, the results after 100 cm3 can be ignored, because they are much more inaccurate than the readings before the syringe was readjusted. Therefore, we can draw the line of best fit through the points that are before the place where the syringe was readjusted. This means that the line of best fit for the 45 oC experiment is no longer a curve, and shows that the rate of release of CO2 did not decrease as the experiment progressed, and so this means that the yeast had enough energy to continue colliding with the glucose molecules. The gradient of Graph 4, the 45 oC experiment, is 0.22. This means that 0.22 cm3 of carbon dioxide was given off per second during this experiment. This supports the prediction that ‘the gradient of the graph produced will be quite steep, and will be the steepest of all the gradients’, meaning that the 45 oC graph would have the steepest gradient. The results of the 60 oC experiment are plotted in Graph 5. The volume of CO2 released increases until 5 minutes, and then the graph levels off. This is because the cells have been denatured, and so are no longer capable of using the glucose for respiring. The overall gradient of the graph is zero, because the reaction stopped after five minutes.
Accuracy
Table 7 shows the gradients of the class’ experiments. All the groups’ experiments found that at 0 oC, 15 oC, and 60 oC there was not carbon dioxide given off. Group A had the steepest gradient for the 30 oC experiment, with 0.07 cm3 of CO2 per second. But all of the gradients are within 0.02 of each other, and this shows that the results that were obtained were all close to one another, adding validity and reliability to all the experiments done at 30 oC. The spread of gradients for the 45 oC experiments is somewhat larger, however. Group A again had the steepest gradient of the class, with 0.16 cm3 of CO2 per second. The shallowest gradient is the one from Group B – 0.11 cm3 of CO2 per second. The average volume of gas given off at 45 oC is 0.136, and so we can say that the volume of CO2 per second that was given off in this experiment is close to the average volume that was given off. This suggests that the experiment that we did at this temperature, and the results that we obtained were accurate. We can conclude that the results from this experiment correlate with the other results, and so this can confirm that we did the experiment accurately. The predictions concerning the gradients of the graphs have been supported by the results that were obtained. This shows that the experiment was done accurately, and that the results are fairly reliable and also that they were consistent with other experiments that have been done. To explain the greater amount of CO2 that was given off, we could say that because the yeast is organic, and not a manufactured chemical, there is no guaranteeing the quality of the yeast’s fermentation abilities. This means that the yeast used in the 45 oC experiment could have been stronger that that which was used in the other experiments, explaining the higher volume of carbon dioxide that was released as a result of respiration. On the whole, all the experiments that were done by the class produced accurate results, and because no extreme anomalies occurred, we can say that the results are accurate enough for the aims of this experiment.
Suitability
The aim of the experiment was to investigate the effect that temperature had on the rate of release of carbon dioxide from a fermenting solution. The results that were obtained from the experiment that we did to meet this aim are sufficient enough. This means that we obtained the results that we need to make analysis and conclusions. The range of readings was large enough, because Fig 1 showed that we could use the temperatures of 0 oC, 15 oC, 30 oC, 45 oC and 60 oC to see how temperature effected CO2 release. The experiment could have been continued for a longer period of time, so that all the reactions had time to finish. This would have increased the accuracy of the experiment, because all the glucose would have been used up, and so the end volume of CO2 that was released could have been found out. This might have helped when directly comparing the volumes of carbon dioxide that were released.
Reliability
A few factors might have made the results of this experiment unreliable. Firstly, the temperature that the reaction took place at was not totally constant, because at times, the temperature was either two degree above or below the temperature it was supposed to be at. This could have caused a small amount of inaccuracy, but would not have been too much. Another factor that could have caused inaccuracy is that the yeast that was used to make up the yeast solution could have been more potent than the other yeast batches that were made up. If we had used the readings that were taken after the syringe was adjusted in all the 45 oC experiments, then we would have also introduced another factor of inaccuracy and unreliability. But because we have not, we can safely say that this is not a cause for concern over the accuracy and reliability of the readings. It was observed that the gas syringe moved easier when near the beginning of the outer casing, and so this could have caused slight inaccuracy in the later readings, because the syringe did not move as smoothly as it had when it was at the beginning of the outer casing of the gas syringe.
Improvements to the method
A larger gas syringe could have been used, so that the experiment could have been carried on for longer in the 30 oC and the 45 oC experiments without the syringe having to be pushed back to the beginning of the outer tubing once 100 cm3 of CO2 had been collected. This added inaccuracy to the experiment, and meant that we could not use the readings that were taken after 100 cm3 of CO2 were collected. If we used a larger syringe, this would not be a problem, and the 30 oC experiment would also have been able to be carried on for longer. The range of measurements about the 45 oC mark could have been increased. This would have narrowed down the exact temperature at which the yeast released the most carbon dioxide. The concentration of the yeast in the solution could be increased or decreased, and the effect of this could be investigated. The concentration of the glucose could also be changed, and how this affected the release of CO2 could be explored.
Improvements to provide additional evidence
The effect of using another source of energy on the release of carbon dioxide could be investigated. This would involve replacing the glucose with sucrose or fructose. We could also investigate the role that the type of yeast has to play in the production of carbon dioxide during respiration. This could be done by using fresh yeast instead of dried yeast, or Brewer’s Yeast. The energy changes involved in fermentation could also be investigated, by measuring the energy taken in or given out by the fermenting solution. The alcohol content of the remaining solution from the experiment could also be investigated. The effect of different types of yeast on the alcohol content could also be investigated.
GCSE Biology Second Edition; DG Mackean; page 20
Practical Biology; Michael Roberts, Tim King, and Michael Reiss; page 83
Biology New Edition; Mary Jones and Geoff Jones; page 15