To control this variable, the temperature is maintained at a fairly constant level that allows the enzyme to work effectively (room temperature, approximately 23ºC). This is achieved by using a test tube rack so that the heat from my hands don’t affect the catalase in the yeast.
pH – Any change in pH affects the bonding of the protein in an enzyme and so alters its shape, and renders it ineffective. Each enzyme has an optimum pH at which its active site best fits the substrate.
In this experiment, the pH is kept constant using a pH 7 buffer (water), selected to maintain a pH level suited to the enzyme, checked before the experiment with no substrate (hydrogen peroxide) added.
Substrate Concentration – When there is an excess of enzyme molecules, an increase in the substrate concentration, produces a corresponding increase in the rate of reaction. If there are sufficient substrate molecules to occupy all of the enzymes´ active sites, the rate of reaction is unaffected by further increases in substrate concentration as the enzymes are unable to break down the greater quantity of substrate.
This is the variable that I will control, by preparing a number of known concentrations of hydrogen peroxide, getting progressively weaker substrate concentrations by adding exact amounts of water to a known hydrogen peroxide (20 vol).
Enzyme Concentration – Provided there is an excess substrate, an increase in enzyme concentration will lead to a corresponding increase in rate of reaction. Where the substrate is in short supply (i.e. it is limiting) an increase in enzyme concentration has no effect.
This factor will be kept constant in this experiment as the variable is substrate concentration by using a set mass of powdered yeast.
Apparatus List
+ Clamp and Stand
+ Test Tubes
+ Hydrogen peroxide, 20 vol
+ Yeast powder
+ Measuring Cylinder, 100ml
+ Glass Bowl
+ Small measuring cylinders for
H2O2 concentrations
+ Stopwatch
+ Delivery tube
+ Bungs
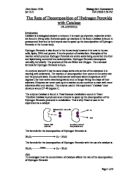
Method
Set up apparatus as shown in diagram above with measuring cylinder submerged in bowl of water.
Prepare a number of 25ml measuring cylinders with varying concentrations of hydrogen peroxide by putting the following dilutions of H2O2 in 6 measuring cylinders;-
H2O2 (ml) Water (ml) % H2O2
5 20 20%
- 15 40%
- 13 50%
- 10 60%
- 5 80%
- 0 100%
This will create 6 different concentrations for reactions with yeast.
Add known amount of yeast powder to clean test tube and add known volume of water as buffer for pH. This gets clamped as shown in diagram.
When ready with stopwatch, add one of the concentrations of H2O2 and take regular readings as to the amount of O2 evolved, i.e every 30s for 3 minutes.
Repeat with same concentration of H2O2 and record results.
Repeat with new concentration.
Trial
To find out what amount of enzyme and volume of substrate to use, I had to do a trial. This involved changing the variables and testing to see if it reacted too much or too little.
1st Trial
I tried using 2 spatulas of yeast powder, with 5 mls of water as a buffer, and 5 mls of neat H2O2 (20 vols). This caused a vigorous reaction which had the “bubbles” of O2 travelling down the delivery tube and interfering with the amount of O2 evolved.
As my variable was the concentration of the H2O2, I thought it would be better to reduce the mass of yeast powder that got added and set a level for the independent variables to use for all the experiments.
2nd Trial
Next, I tried only 1 spatula of yeast powder and te rest of the above amounts the same to see if this controlled the reaction to an accurate level. It proved to take about 4 minutes for the reaction to stop completely and 2.5 to slow right down. This made me decide to measure the oxygen level for 3 minutes as the other concentrations are weaker so it wouldn’t exceed the trial level.
After the 2nd trial, I was satisfied that the amounts of each materials would be enough to test accurately and I could do the experiment.
Actual Results
Analysis of results
As can be seen from the graph, the prediction at the start of the plan was accurate, the rate of reaction did increase as the concentration of the hydrogen peroxide increased as the amount of oxygen evolved increased significantly.
There is no distinct plateau, as expected, because the maximum enzyme-substrate ratio was not met, meaning that to increase the concentration of the hydrogen peroxide even more would result in even more oxygen evolved in a shorter time.
Limitations
To allow this experiment to be completed as accurately as possible, I repeated it twice, when the results conferred quite closely, I felt that an average of these 2 results would be enough to show the significant increase. I then used my average of the results to plot a simple graph to represent what the experiment proved. I tried my best to keep all the variables apart from the one I was testing (hydrogen peroxide concentration) the same as described earlier.
Unfortunately in practice it is impossible with the basic apparatus I had to keep all measurements precisely the same. For example:
1. There is a slight delay between pouring the hydrogen peroxide into the test tube and putting the bung in and starting the stopwatch. To combat this inaccuracy, I carried out the timings exactly the same way each time, meaning that any time lost between this would be the same each time and therefore keep the results consistent with each other.
2. It is also impossible to precisely measure out the amounts of hydrogen peroxide and water each time. As the scale on the measuring cylinder shows the measurement to the nearest 1ml3, the solutions that I used should be correct to the nearest ml3, which is accurate enough not to show a significant error margin on the graph.
3. In placing the bung in the top of the test tube, air is trapped in the top and pushing on the bung during the experiment could have forced extra air throught the delivery tube and hence, made the results innaccurate. The only way to avoid this was to ensure that the bung was firmly in at the start of each experiment and not touch it throught the timings.
4. The measurement of the enzyme, catalase in yeast powder, was difficult to measure in small masses, meaning that it couldn’t easily be weighed on a balance. This left a possible error in the judgement of “1 spatula” of yeast powder in each test tube. This could only be reduced by as careful measuring as possible.
Evaluation
The pattern shown by the results table and graph are reliable in that the support my prediction made in the plan completely and they show no significant deviation from the expected increase in the oxygen evolved.
The pattern shown on the graph was made by 6 different concentrations of hydrogen peroxide which gave a good enough range to show clearly what I intended.
As can be seen on the graph, there is a slight plateau between 40% and 60% vol of H2O2 and also the gradient at the start of the graph is lower than on the final concentration. This could be because the amount of enzymes in the yeast can vary from sample to sample, therefore possibly reducing the number of active sites available for the substrate. It could also be that at that concentration the number of substrate molecules increases and the enzyme can only split one substrate at once so the oxygen evolved slows down. The only way to see if this is an anomaly is to test more of the yeast at that concentration.
But there are no distinct anomalies on the results that I have. This helps to prove the prediction more strongly.
Suggestions for improvement
Make the measurement of H2O2 and the water amounts in the different concentrations more accurate by using a volumetric pipette and smaller measuring cylinders. Then the numbers of concentrations can be increased as they are more accurate and a smoother curve should be shown on the graph with a steadier gradient.
Make some concentrations of H2O2 above 20 vol, (100%) to show what happens when there is an excess of substrate to enzyme. This would, once again, make the graph more accurate as the plateau would be clear.
Francesca Spencer 13JC 02/05/07 Page of