Similarly I took 3 readings for the depth of the ruler at any three different places of the ruler by using a screw gauge to give an average depth of the ruler. I also took 3 readings for the breadth of the ruler using a vernia calapus to give me an average length. An average is taken for almost all the reading to minimise errors while calculating the young’s modulus of the ruler.
INTENDED READINGS.
The readings that will be taken for this experiment will be the measuring the deflection of the wooden ruler when different weights ranging from 100g to 1kg is added in intervals of 100g are added to the wooden ruler. This process will be repeated 4 times with different sides of the ruler as mentioned in the method above. The depth of the ruler can be measured using a screw gauge. This will be measure 3 times at different parts of the ruler to give an average depth. Also the breadth of the ruler can be measured using a vernia calapus. This will also be done 3 times at different parts of the ruler to give an average breadth. All these readings are taken a number of times to give an average for all the values for the final calculation of the young’s modulus.
SAFETY CONDITIONS.
When the experiment is conducted, it must be insured that all of the apparatus is attached securely to ensure that nothing comes apart. Also check that all the apparatus are in good condition for the experiment to work well. General laboratory rules must be recognised to ensure safety throughout.
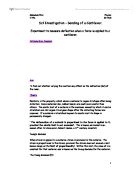
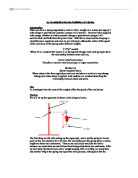
As for the method that has been done to do this experiment proves to be fairly good. As we are trying to prove that, as hooke’s law says if one side is in tension the other will be in compression hence the same way in the experiment one end of the ruler was clamped and weights were hung on the other end hence one side of the ruler was under tension and the other in compression and from preliminary work done and my knowledge from the text book this method proved to work. Hence I adopted this method.
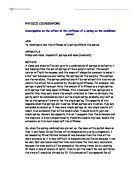
ANALYSIS
RESULTS FOR MYEXPERIMENT.
1st Reading for the deflection of the ruler. 2nd Reading.
3rd Reading. 4th Reading.
These values are the average for all the above reading for the deflection of the ruler.
There were other values taken as well like the area of the ruler was measured with a screw gauge 3 times to give an average value.
The length of the overhang was approximately 70cm.
There were values taken for the breadth as of the ruler as well these values were taken 3 times as well to get an average value.
I also used the value of the gravitational force which is a constant 9.81Nkg –1.
SOURCES OF ERROR.
The experiment was carried out fairly accurately but still there were errors that were consistent and variable throughout the experiment. As the consistent errors were that the screw gauge that I used to measure the width of the ruler had a zero error of –0.01mm.As the ruler was clamped on one end and on the other end the weights were hung there was a ruler that was clamped along with this ruler so that the deflection could be measured but both of these rulers had a bent initially because of its own weight but these deflections were different hence this slightly affected my accuracy of my final result. The variable error was that, the weights were not hung from a fixed position this also could have affected results.
ACTION PROPOSED TO MINIMISE ERRORS.
As for the zero error in the screw gauge was –0.01mm. I improved my results by adding this error onto the readings that I got for the width of the ruler. As the weights were hung at different positions I took four reading for each weight and its deflection so that I could get a more accurate result. Also for the other readings, like measuring the width, the breadth were measured a number of times so that the results could be more accurate.
CALCULATIONS.
The graph is plotted with weights (w) in kg on the X-axis and deflection (y) on the Y-axis. Hence the gradient of the graph will be = y/w .The gradient of the graph which I calculated on the graph by using the formula:
gradient = change in y/change in x which gives a value of 0.096 mkg –1 .
(for calculation refer graph.)
Since the gradient is know calculated we can calculate the young’s modulus for the wooden ruler using the formula :
E = ( 4L3 / ydb3 ) *W
Where E in young’s modulus, L is the length of the overhang of the ruler, y is the deflection, d is the breadth of the ruler, and b is the depth of the ruler. Since the gradient of the ruler was y/w, we can now calculate the young’s modulus by rewriting the above formula as:
E = 4L3g / b3d gradient
Were g is the gravitational force (g) with a value of 9.81Nkg-1
Since L = 0.7m, b = 0.0289m , d = 6.51*10^-3 m, gradient = 0.096 kgm-1
Hence
E = 4*0.7*9.81 / (6.51*10^-3)^3*0.0289*0.096
Therefore E = 1.77*10^10 pa.
Therefore young’s modulus is 1.77*10^10pa
CONCLUSION.
From the readings I took during the experiment I could calculate the young’s modulus that gave me an almost accurate answer from my point of view. I have given my average results in 2 decimal places so that the final result could be made accurate.
The line on the graph for the weight against the deflection was not perfectly a line of best fit, but a line that goes through all the points on the graph that means there are no odd results that may throw off the reading. There is a full positive correlation, which shows that the experiment was carried out accurately each time the experiment was done and a reading was taken.
Hence my results show and prove that my prediction and scientific knowledge were accurate. I have proved that the young’s modulus of the cantilever beam is 1.77*10^10 pa.
The method in which I carried out my experiment was reliable as it gave an accurate set of results that was supported by the theory.
EVALUATION
SOURCES OF ERROR.
There could be many errors in the experiment that could have affected the accuracy of the result. First of all measuring the deflection of the ruler with certain weights as they had an initial bent due to their own weight. Screw gauge that I used during my experiment to measure the breadth of my ruler had a zero error of -0.01mm.Weights that were hung on one end of the ruler was not hung at a fixed position this could affect the value for the deflection.
I used a screw gauge to measure the breadth and the vernia calapus, which I used to measure my depth of the ruler with. The screw gauge I used had a sensitivity of 0.1mm,and the vernia calapus had a sensitivity of 0.2mm.
Systematic errors in the experiment were; the zero error in the screw gauge, the initial bend of the ruler due to its own weight, hence this had a impact on the measurement of the deflection throughout the experiment.
Random errors in the experiment were; the weights hung on different positions at one end of the ruler. The overhang of the ruler slightly varied as different sides of the ruler used to find out the deflection with the same weights to give an average value for the deflection of the ruler.
Measurements taken on the ruler had some errors and they were, initial bent of the ruler due to its own weight affecting the deflection, weights hung on different positions on one end of the ruler affecting the deflection. Also the slight variation in the length of the overhang of the ruler when the experiment was repeated.
Screw gauge used had a zero error of -0.01mm and it had a sensitivity of 0.1mm.
Vernia calpus used had a sensitivity of 0.2mm.
The experiment was carried out as accurately as I could and according to my result and the graph I think that they was no anomalous results in my experiment.
Throughout the experiment the same apparatus were used even for the repetitions. The only thing that varied during the repetitions was that I used different sides on the ruler to check that the deflections at each side were almost the same.
The method used for the above experiment was quite reliable. As the apparatus used were the same throughout the experiment.
To improve the method by which I carried out my experiment will be to use a screw gauge, which does not have a zero error. Fix a point on one end of the ruler for the weights to be hung so that there are no errors while reading the deflection of the ruler. Use a fixed length for the overhang. Initially see that the ruler does not have bend, if it does use a similar ruler with the same amount of bend length to place it next to the ruler on which weights are hung to get an accurate reading for the deflection.
The experiment was done fairly accurately and gave me a set of results that were fairly accurate and were similar to my prediction, which I made from reference. So I think this method of doing this experiment was fairly good.
Reference: Understanding physics for advanced level by Jim Breithaupt.
Websites: ,