- Carrots and Parsnips (the 2 sweet vegetables) and
- Turnips and Swedes (the two vegetables that are not so sweet).
The reason I am using 2 sweet vegetables and 2 that are not so sweet, is to compare the vegetables and see which sweet vegetable and which not so sweet vegetable will give me the largest change in mass when exposed to osmosis. I will then able to use these in the actual experiment.
From my pilot study, I expect to find out:
- Which vegetables to use in my actual experiment
- Which variables to manipulate and change in the experiment, and
- The amount and concentration of sucrose solution to use.
Equipment:
- 1 size 5 cork borer. This will be necessary to cut up the pieces of vegetables for my experiment. I will use the same cork borer to cut up all pieces for my experiment, to try to eliminate any possible size difference.
- 1 mol of sucrose solution. This will be required to create the different molar solutions of sucrose
- I will require each of the vegetables mentioned above in order to see which vegetables gain the biggest change in mass
- 16 test tubes, to immerse the vegetables in for the experiment to take place
- 1 test tube rack to hold the test tubes
- 1 scalpel, to cut up the vegetables to be placed in the test tubes.
- 1 cutting tile, to avoid damage to the desks, and to keep the desk surface clean
- A ruler, to measure out the length of the vegetable cylinders
- Blotting paper to blot the vegetable cylinders once I have taken them out of the sucrose solutions
- A digital top pan balance to weigh each of the cylinders before and after the experiment
Method:
- Use the 1mol solution of sucrose to create solutions of each of the following concentrations in 4 separate test tubes: 1 mol, 0.5mols and 0.25mols. Place the test tubes in the test tube rack.
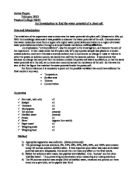
- Use the cork borer to get 3 cylinders of each vegetable. Cut them to size by using a scalpel ensure that they all have the same length (3 cm long).
- Weigh them on the digital top pan balance. Record the surface area and mass in a suitable format
- Place all of them, one each, in each of the specified solutions
- Leave them for half an hour
- Take them out, dry and blot them (using blotting paper) and weigh them once more. Record the result, and compare with previous mass.
Risk assessment and safety procedures:
As with all experiments, I must consider the risks of this experiment and take adequate precautions.
- Goggles and a lab coat must be worn at all times during the experiment, in case of spillage of the sucrose solution, or any other accidents that may occur.
- I must also be cautious with the use of the scalpel and cork borer, as they are shape implements, and could cause serious injury if it is not used correctly.
- Sucrose, if spilled, could also prove a hazard, especially if it is of high molarity, as it could cause damage to the laboratory environment. It must be dealt with promptly if spilled.
- Care must also be taken when using the test tubes. If dropped, the broken glass could be a hazard and could cause injury, if it is not cleared away properly.
Table of results:
I think that my results look fairly reliable, due to the fact that all the vegetables in the 1 mol solution should lose mass and all vegetables in the 0.5 solutions and 0.25 solutions should gain mass.
From my results I can see that the carrot and the turnip had the biggest change in mass, I have decided therefore, to use these vegetables, as they will give me the biggest change in mass, and should therefore give me clearer more precise results. Furthermore, I think that I would also gain more accurate results if I left both the turnip and carrot in the solutions for a longer period of time, as it would allow further osmosis to take place.
I have also decided to use different concentrations of sucrose. These will be: 1.0 mols, 0.8 mols, 0.6 mols, 0.4 mols 0.2 mols and 0.0 mols. I have decided to use these concentrations for 2 reasons:
- By using more concentrations I will gain more accurate results.
- It will be easier to measure out these concentrations rather than the ones used in my pilot study.
Key variables that must be considered: The following variables must be taken into consideration before the experiment takes place:
-
The surface area of the vegetables: This must be considered, as it could have a huge impact on results. It is the main variable that I will be testing. It is important that all cylinders are of the same length and are all made using the same cork borer. This is because, if the surface area of a cylinder is bigger, more osmosis could take place, therefore it could increase/decrease the vegetable mass more than it would if it were the correct length, thus giving me anomalous results.
-
The type of vegetable I use will also be a controlled variable. I have decided to use a carrots and turnips, as they give me the biggest change in mass. I therefore think that they will give me the most reliable results.
-
The sucrose solution: The solution in which the vegetables are placed in must be made precisely and accurately, for every experiment. If too much sucrose, or too much water were placed in a solution, anomalous results could be produced, as the solution could be more concentrated or more dilute, therefore, I would not be measuring the mass of the vegetable at the mass I thought I was. The concentration of the sucrose solution is a dependent variable, as it is a variable that I control in the experiment.
-
The mass of the vegetable: The mass of the vegetable is the dependent variable. It is the variable that will change depending on what solution it is placed it. I must ensure that I have weighed the correct mass before I put either the carrot or turnips into each of the solutions. I must also ensure that I have dried off all vegetables before weighing them again after they have been removed from the solution.
Method for actual experiment:
-
Use the 1 mol solution of sucrose to create of each of the following concentrations in 2 separate test tubes: 0.0 mol, 0.2 mols, 0.4 mols, 0.6 mols, 0.8 mols and 1 mol Place the test tubes in the test tube rack. All of the solutions should be 10cm3 in total. There should be 10 test tubes in all, one test tube for each vegetable containing the solutions stated above. Below is a table that shows how to create each of the solutions:
- Use the cork borer to get 3 cylinders of each vegetable. Cut them to 3cm cylinders by using a scalpel. Ensure that the cutting is done with precision so that all cylinders have the same surface area.
- Weigh them on the digital top pan balance. Record the mass in a suitable format.
- Place all of them, one each, in each of the specified solutions.
- Leave them for 45 minutes.
- Take them out, dry them and weigh them once more. Record the result, and compare with previous mass.
The equipment, and also therefore the risk assessment I use, will be exactly the same as I used in the pilot study (as stated above).
Tables of results:
We carried out this experiment 3 times in total. Each time, we carried out the method exactly as stated above. We did this so that we got a good quality results. It would also ensure that anomalous results could be spotted with ease, as all 3 experiments have yielded similar results, although, I have gained some anomalous results.
Below Is the Results table for the 3 different experiments I conducted on Turnip:
(I have discounted all anomalous results when calculating the Average % Change in Mass)
Here is the table of results for the experiments I conducted on the Carrot:
(I have discounted all anomalous results when calculating the Average % Change in Mass).
From my results I can see that, as I predicted, turnips have a higher water potential than carrots. As the sucrose solution becomes more concentrated, the more mass the vegetables lose. Carrots, the sweeter of the 2 vegetables loses less mass than that of the turnip.
I can see that, my turnips have a water potential of -1300/kPa and my carrots have a water potential of -950/kPa. In less concentrated solutions (0.2mols, 0 mols), turnips gains more mass than carrots, and in more concentrated solutions (0.4mols, 0.6mols, 0.8mols, 1mol); turnips lose more mass than the carrots.
This leads me to conclude that unsweet vegetables have a higher water potential than sweeter vegetables. This could be due to the fact that turnips, as a less sweeter vegetable, contains less sucrose than sweeter vegetables such as carrots, therefore, when placed in solutions with a high concentration of sucrose (higher than the amount of sucrose in the vegetable), osmosis will take place, and water will be drawn out of the cells by the sucrose, causing the vegetable to lose mass. When placed in solutions with a low concentration of sucrose (lower than the amount of sucrose in the vegetable), water will be drawn into the turnips cells, causing the vegetable as a whole to gain mass.
Both of my graphs appear to have the same trend. At point A, when immersed in pure water, both my turnip and my carrot have gained mass. This is due to the fact that osmosis has taken place and more water molecules have entered the carrots/turnips cells. At point B, equilibrium has been reached. There is no net movement of water molecules. This occurs at a sucrose solution of 0.36 mols for the turnip and 0.34 mols for the carrot. It takes place as the concentration of sucrose solution outside of the vegetables is equal to that of the concentration of sucrose solution inside the vegetables.
At point C, Both vegetables have started to lose mass. This could be due to the fact that the cells may have been plasmolysed and are therefore losing mass.
I feel as though my experiment is both reliable and accurate, as it gives me consistent results that seem sensible. To ensure that my experiment was reliable, I repeated it 3 times for each vegetable. Each different experiment gave me similar, consistent results.
I gained 3 anomalous results. 2 were in the first experiment, 1 was in the second experiment. All are highlighted in red on the tables. When calculating my 'Average % Change in Mass', I did not take these results into account. These results could have been gained because of the following reasons:
- The concentration of the solutions may not have been made up correctly; the meniscus of the solutions measured out may not have been exact.
- The carrot or turnip may not have been weighed correctly, either before I placed vegetables in sucrose solutions or after.
- The experiment was conducted in different rooms for each of the tests, there for the temperature may have been different for each experiment.
- Different vegetables of different ages were used. The first carrot used in the first experiment may have contained more water than the carrot used in the second experiment.
Limitations:
There are 5 limitations that I had very little control over in my experiment. These were:
- The fact that I was unable to conduct my experiments on the same day, one after another, meant that I had to use different vegetables on different days. This may have had a major impact on results, as the older vegetables could have contained less sucrose and water and therefore, could have affected the results of my experiment as a whole.
- For my second experiment, I was in a different laboratory. This could have affected my results, as it could have meant that the temperature of the experiment was different to that of the other 2.
- I may not have cut my vegetables up with complete accuracy, due to the fact that, due to time constraints, all vegetable cylinders had to be cut to size quickly. I could have, therefore, made mistakes when cutting up my vegetables.
- I also did not take into account which parts of each vegetable I used. This may have had an effect on my results, as different parts of each vegetable may have given me different results.
-
My pipette may also not have been very accurate, or, again due to time constraints, I may not have measured the exact amount for each solution, the meniscus of the sucrose/water may not have been exactly where it was supposed to be. I used a 10cm3 graduated pipette, which could only measure to an accuracy of + or - 0.05 cm3. This means if I measured a volume of 4.0 cm3 for example, the pipette would not measure an exact volume of 4.0 cm3 but would measure a volume that would fall within the limits of 3.5 cm3 and 4.5 cm3 (Reference: Biology Investigation, , Lab techniques: Biochemistry - 3. Dilution series and pipetting errors). The pipetting error for each of my solutions mage would be as follows: I used a 10cm3 pipette to make up each of the solutions. For my 1 mol solution of sucrose, and my pure water solution (0 mols of sucrose), I used the pipette only once. For my 0.2 mol, 0.4 mol, 0.6 mol and 0.8 mol solutions, I used the pipette twice. Therefore, for my 1 mol solution of sucrose and for my solution of pure water, the pipetting error can be calculated as following:
0.05 x 100 = 0.5% 10
For my other solutions of sucrose, since I used the pipette twice, the pipetting error can be calculated as followed: (2 x 0.05) x 100 = 1%
10
Of all my limitations, I think that the fact I used different vegetables on different days had the most adverse effect on my experiment, as it would mean that the concentration of sucrose in each of the vegetables would be different, it would therefore affect the rate of osmosis in a huge way.
Improvements
If I were to carry out this investigation again, I would make the following improvements to try to eliminate any sources of error:
- I would conduct the experiment using the vegetables that were grown and produced in the same field 3 times, one after another. I think that this would make a fair improvement to my results, as it would mean that all results came from the same vegetables that were all similar to each other.
- I would conduct all experiments in the same laboratory to avoid change in temperature affecting my experiment.
- All vegetable cylinders would be cut to the exact same size, to ensure that the surface area for all cylinders was exactly the same.
- I would try to use the same part of every vegetable.
- I would measure the each amount exactly, ensuring that the meniscus of the solution in the pipette was touching the exact amount I wanted to measure.
Although there were many limitations to my experiment, I feel as though I have gained accurate and reliable results and I can disregard these limitations, as I have gained a strong pattern of results.
Bibliography
Revise AS Biology for OCR, Richard Fosbery, Jennifer Gregory, Ianto Stevens, page 26-
Exchanges Across Membranes
Cambridge Advanced Sciences, Biology 1, Mary Jones, Richard Fosbery, Dennis Taylor, pages 57-59, 'Osmosis in plant cells'
Biology Investigation, , Lab techniques: Biochemistry - 3. Dilution series and pipetting errors