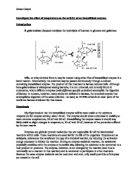
Lactose is found most commonly found in milk, which is used by millions of people every day. It is a disaccharide sugar, made of its two constituent monosaccharides – glucose and galactose. The enzyme lactase (which is extracted from yeast fungus) can be used to break down the lactose into these monosaccharides, making it possible for people who are lactose intolerant to drink milk.
Apparatus Justification
·Marvel milk powder – this contains the lactose which is to be broken down
· Lactase – This is the enzyme which catalyses the breakdown of lactose into glucose and galactose
· 2 % Sodium Alginate – This needs to be made into a solution with distilled water, because calcium ions in tap water will cause the sodium alginate to set
· Electronic Scales – These are used to get accurate measurements when weighing
· Hot Plate – This is used to heat the sodium alginate
· Follower Magnet – This is used to mix the sodium alginate and distilled water together
· 2% Calcium Chloride Solution – This reacts with the sodium alginate to form the calcium alginate beads
· 2 syringes – one to syringe the Calcium Chloride, and the other to syringe the lactose
·5 Pipettes – These need to be cut in order to produced beads of varying volumes. At least five different sizes need to be cut in order to have enough results to plot on a graph
· Beakers – Several beakers will be needed to weigh and mix into
· Tea Strainer – This is used to separate the calcium alginate beads from the sodium chloride solution
· Spatula – This was used to weigh out substances onto the scales and to move the enzyme beads from the tea strainer to the plastic syringe barrel
· Glass rod – this was used to mix substances together
·10cm³ Plastic Syringe Barrel – This is what the immobilised enzymes are placed into in order for the process to occur. It is the best size to fit this amount of enzymes
· Nylon Gauze – This prevents the beads from becoming stuck in the outlet of the syringe barrel
· Tubing – This is attached to the outlet so the milk can be lead into the collection beaker
· Screw Clip – This is attached to the tubing so that it can regulate the flow of the milk coming through
· Retort Stand – This is used to hold the plastic syringe barrel in place
· Glucose Test Strips – These will change different colours to indicate the concentration of glucose
· Stop Watch – This will be used to investigate the relationship between time and glucose concentration
Variables
· The screw clip which is applied to the tubing must be kept at the same tightness throughout the experiment or it will effect the flow rate of the milk from the syringe barrel.
· The mass of the alginate beads used in each test must be the same as it is likely that if there are more beads, they would cause the rate of reaction to increase.
· The concentration and amount of the calcium chloride used should remain the same, as it should for the lactase and the sodium alginate used.
· A change in pH would affect the rate of reaction so this is kept constant.
· The experiment will be conducted at room temperature to ensure that it stays the same and does not therefore affect the rate of reaction.
Safety
Lactase:
·All enzymes are potential irritants
· Wear eye protection and gloves when handling the enzyme
Calcium Chloride:
· Calcium is an irritant to the eyes and skin, prevent this by wearing goggles and a lab coat whilst handling
· Harmful to the respiratory system, so avoid inhalation
Sodium Alginate:
· Reasonably harmless, care should be taken to avoid the eyes and not to swallow
General safety in the laboratory:
· Coats and bags hung up, stools pushed in. All passages and fire exits should be clear. Other peoples experiments should be taken into account, so do not run, leave bottles of harmful substances unattended, Bunsen burners when not in use should be set to an orange flame.
Pilot Experiment
- The sodium alginate solution had to be made up. In order to do this, 2 grams of Sodium Alginate were weighed out, and then placed into a 100ml beaker. This was then topped up to the 100 ml mark with distilled water. As it is difficult to make sodium alginate into a solution, the beaker was placed onto a hot plate to warm up. The hot plate was turned on to a medium/ low temperature. The mixer was turned on, and a follower magnet was dropped into the solution. This spun around because of the mixer, and gradually dissolved all the alginate into the water.
- Whilst this was being mixed, the pipettes were prepared. In order to do this, the ends had to be cut down to different diameters (1.5 and 5.5) so that the immobilised enzymes produced would have different volumes.
- The apparatus was then set up. The gauze was placed at the bottom of the syringe barrel, which was held in place by a retort stand. To the outlet of the syringe barrel the rubber tubing was attached, and the screw clip was fastened onto that. A beaker was placed underneath to catch the processed milk.
- When the sodium alginate solution was fully mixed, 8cm³ was taken up into a syringe and placed in a beaker. To this, 2cm³ of the lactase was added and mixed together with a glass rod. 100cm³ of Calcium Chloride was placed in a beaker, and the alginate – lactase mix was taken up in pipette number 1 and added drop by drop to this. The beads formed immediately but were then left for at least 20 minutes to harden.
- After hardening, the alginate beads were sieved using the tea strainer, and 2 grams were weighed out onto the scales. The beads were then moved using a spatula to the plastic syringe barrel. At this point the Marvel milk was poured into the top of the syringe barrel and the timer was started.
- The milk dropped out of the tubing at a steady rate, and every two minutes a drop was tested for glucose using a diastix. This was repeated until the glucose concentration was up to 2%. The entire experiment was then repeated for the pipette with a diameter of 5.5, and the results were recorded in the table below.
Test One – This didn’t work at all, as the milk would not come through the gauze. Due to this, it was realised that the Marvel milk powder made the milk too thick, and trying normal milk might work better
Test two – The normal milk worked perfectly, and the results of the experiment were recorded in the table below.
These results make it clear that there is a range of results to investigate in further detail. The only adjustment needed was to use normal pasteurized milk instead of Marvel milk powder, as shown on the new apparatus list below.
New Apparatus List
·Pasteurised Milk
· Lactase
· 2 % Sodium Alginate
· Distilled Water
· Electronic Scales
· Hot Plate
· Follower Magnet
· 2% Calcium Chloride Solution
· 5 Pipettes
· Beakers
· Tea Strainer
· Spatula
· Glass rod
· 10cm ³ Plastic syringe Barrel
· Nylon Gauze
· Tubing
· Screw Clip
· Retort Stand
· Glucose Test Strips (Diastix)
· Stopwatch
Method
- The sodium alginate solution had to be made up. In order to do this, 2 grams of Sodium Alginate were weighed out, and then placed into a 100ml beaker. This was then topped up to the 100 ml mark with distilled water. As it is difficult to make sodium alginate into a solution, the beaker was placed onto a hot plate to warm up. The hot plate was turned on to a medium/low temperature. The mixer was turned on, and a follower magnet was dropped into the solution. This spun around because of the mixer, and gradually dissolved all the alginate into the water.
- Whilst this was being mixed, the pipettes were prepared. In order to do this, the ends had to be cut down to different diameters (1.5, 2.5, 3.5, 4.5, 5.5) so that the immobilised enzymes produced would have different volumes.
- The apparatus was then set up (as shown in the diagram below). The gauze was placed at the bottom of the syringe barrel, which was held in place by a retort stand. To the outlet of the syringe barrel the rubber tubing was attached, and the screw clip was fastened onto that. A beaker was placed underneath to catch the processed milk.
- When the sodium alginate solution was fully mixed, 8cm³ was taken up into a syringe and placed in a beaker. To this, 2cm³ of the lactase was added and mixed together with a glass rod. 100cm³ of Calcium Chloride was placed in a beaker, and the alginate – lactase mix was taken up in pipette number 1 and added drop by drop to this. The beads formed immediately but were then left for at least 20 minutes to harden.
- After hardening, the alginate beads were sieved using the tea strainer, and 2 grams were weighed out onto the scales. The beads were then moved using a spatula to the plastic syringe barrel. At this point the milk was poured into the top of the syringe barrel and the timer was started.
- The milk dropped out of the tubing at a steady rate, and every two minutes a drop was tested for glucose using a diastix. This was repeated until the glucose concentration was up to 2%. These results were recorded in the results table and plotted onto a graph. The entire experiment was then repeated with the other pipette sizes, 2 – 5.
Diagram
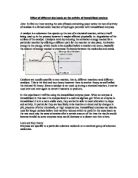
Results – This shows glucose concentration against time. The concentration of glucose is read from the side of the diastix bottle, and is shown as a percentage.
The chart above shows the results of the first run through of the experiment. I managed to repeat my experiment once, and by doing this I have obtained a more accurate set of results, as anomalous results will be averaged out. The average time taken to produce 2% glucose milk has been written out in a chart below the repeats. On the chart below are the results of the second run through of my experiment.
Average Results
This shows the average amount of time it took for each volume of bead to break down the lactase in the milk.
The average time was then compared with the surface area to volume ratio for each immobilised enzyme volume to produce graph number 1. The following information was used to plot the graph.
For Graph 2, the surface area to volume ratio is shown against the rate of reaction. The rate of reaction is discovered by calculating 10000/T (T representing time). The calculations are shown in the chart below.
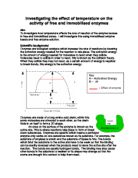
Analysis of results
As the surface area to volume ratio of the beads increases, the time taken to react decreases. This means that as the surface area to volume ratio decreases, so does the rate of reaction (this is shown in graph 2). This agrees with the hypothesis, which states that if there is a smaller surface area to volume ratio, the amount of active sites the substrate is in contact with decreases, as less enzyme is on the surface of the immobilised beads. Therefore, the rate of reaction decreases. From the graph it is evident that as the surface area to volume ratio of the bead increases steadily, so the time taken decreases proportionally. This shows a clear relationship between the surface area to volume ratio and the rate of reaction. From Graph 1, it becomes apparent that the second result (with a surface area to volume ratio of 1.33) is anomalous. This may be due to several factors affecting the reliability of the results. These will be explained in the evaluation.
Evaluation
The factors affecting the reliability of the results are from two main areas
· Human error (potential)
- Readings may be taken inaccurately, for example, it is down to personal judgement when deciding the concentration of the glucose test strips, as colour change is subtle.
- Measurements may be made inaccurately, such as the weighing out of the sodium alginate.
- There is a reaction gap, the time between the milk being poured into the immobilised enzymes and the timer being started. Also, between the stopwatch marking 120 seconds and the processed milk being tested with a glucose strip
- The milk was poured into the syringe barrel at an inconstant rate. This is discussed at the end of the evaluation under further investigations.
· Equipment error
- There are different amounts of substrate and enzyme in the solutions due to chemical make up, which makes it very hard to control
- There is a percentage of error when using the equipment. This can be calculated by dividing the degree of accuracy by the minimum reading taken, and multiplying it by one hundred to find the percent. This is demonstrated in the table below
Total percentage error is 0.25 + 33.33 + 5.0 = 38.58
Calculating error bars
1. x axis = 1.09
y axis = 1680 1680/100 x 38.58 = 648 648/2 = 324 324 seconds either way
1680 – 324 = 1356
1680 + 324 = 2004
2. x axis = 1.33
y axis = 1980 1980/100 x 38.58 = 764 764/2 = 382 seconds either way
1980 – 382 = 1598
1980 + 382 = 2362
3. x axis = 1.71
y axis = 2220 2220/100 x 38.58 = 856 856/2 = 428 seconds either way
2220 – 428 = 1792
2220 + 428 = 2648
4. x axis = 2.40
y axis = 2700 2700/100 x 38.58 = 1042 1042/2 = 521 seconds either way
2700 – 521 = 2179
2700 + 521 = 3221
5. x axis = 3.99
y axis = 3300 3300/100 x 38.58 = 1273 1273/2 = 637 seconds either way
3300 – 637 = 2663
3300 + 637 = 3937
Conclusion
I conclude that the results are reasonably reliable but could be improved upon. It must be taken into account that this was a one off experiment involving one batch of the enzyme solution and one batch of the substrate solution. It may not be representative of experiments of the same kind. However, the results achieved follow the ideas put across in the hypothesis, and although they are not exact they show a definite correlation between rate of reaction and surface area to volume ratio.
From the error bars it is clear that there is potentially a large degree of error, but from their agreement with the hypothesis it is likely that they are fairly accurate and reliable. It is also evident that despite the width of the error bars, no drastically different line of best fit could be fit through, so the general pattern shown by the reaction is likely to be correct.
Further Investigation
This would be controlling the variability of the results to a more accurate degree. The variability that needs to be controlled is the flow of the milk into the syringe barrel, which in my experiment occurred at an inconstant rate. This investigation is described below:
New Method
· Follow stages 1 and 2 of previous method
· During stage 3, also set up a biurette leading into the top of the syringe barrel, as shown in the diagram below
· Follow stage 4 of the previous method
·5. After hardening, the alginate beads were sieved using a tea strainer, and 2 grams were weighed out onto the scales. The beads were then moved using a spatula into the plastic syringe barrel. Milk was poured into the biurette, and the valve at its base was opened. At this point, the stop watch was started.
· Follow stage 6 of the previous method
Diagram
In further investigations of this experiment, more repeats should be carried out in order to obtain more accurate results. Also, a greater range should be investigated, for example bead diameters of 1, 2, 3, 4, and 5. Finally, it could also be expanded by using different types of milk.