Results are shown in a table below of the effect of growth of bacteria micrococcus luteus
The mean of each micrococcus luteus bacteria pH are represented on a bar chart below
Conclusion
From looking at the bar chart above of the ranges of pH I conclude the pH7 is the suitable condition for which the bacteria micrococcus luteus can grow in.
Discussion of results
From looking at the mean results pH 7 had the highest value of bacterial growth than the other pH values therefore it shows that micrococcus luteus bacteria had it best growth in pH7. pH 5 had the lowest value of bacterial growth which this shows that pH 5 is the worst condition in for micrococcus luteus to grow in. pH 4 and 6 had 0.01 difference between each other but did not produce enough micrococcus luteus bacteria than pH7.
Apparatus: 4 universal bottles at different pH’s, Escherichia coli, micrococcus luteus, pipettes, incubator, 4 test tubes, colorimeter.
Method of temperature
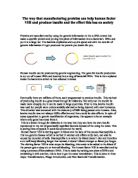
4 universal bottles are used which contains nutrient broth. With using aseptic techniques in the procedure, 1 drop of culture of the bacteria Escherichia coli is inoculated in each of the nutrient broth as the equipment used for this was a pipette. After this each of the nutrient broth were incubated a certain temperatures which were 4, 20, 35, 60 degrees. These were kept in these temperatures for 3 days. After 3 days have been passed the content within each bottle were mixed and were transferred into a test tube as each of the temperature condition was set to an absorbance of 0 by using a nutrient broth with out no bacterial culture. From here we are able to measure the absorbance of the bacteria at each bottle. This produced was same applied to the bacteria of micrococcus luteus.
The cloudiness that caused in the culture is the bacteria suspended in nutrient broth. This means that more light is absorbed by the culture since there are more cells in the culture. To measure the light absorbance by using bacteria cultures a colorimeter is used. The colorimeter is standardised to a reading of zero absorbance with a nutrient broth that doesn’t contain any living bacteria.
The results of the bacteria Escherichia coli at each temperature are shown below.
The mean of each Escherichia coli bacteria at certain temperatures are represented on a bar chart below.
From looking at the bar chart above at the different temperatures I conclude that 20 degrees is the best temperature for which the bacteria Escherichia coli to grow in.
Discussion of results
From looking at the mean results at 20 degrees it had a mean value of 1.04 which this was the highest mean value compared to the other values. The second degree in which the E.coli can grow in is at 35 degrees as there is a 0.12 difference between the 20 degrees but more E.coli growth is produced than in 35 degrees. At 4 and 60 degrees they values came out to be 0.01 which are the same as these temperatures are to extreme or unsuitable for which the E.coli bacteria can grow in. At 4 degrees it is too cold for the bacteria to grow and slowed down their reactivity therefore making no production of growth and at 60 degrees the temperature is too high for the growth of the bacteria which they would of become killed or denatured this mean no growth of bacteria.
The results of the bacteria micrococcus luteus at each temperature are shown below
The mean of each micrococcus luteus bacteria at certain temperatures are represented on a bar chart below.
From looking at the bar chart above at the different temperatures I conclude that 20 degrees is the best temperature for which the bacteria micrococcus luteus to grow in.
Discussion of results
These mean results of the micrococcus luteus where similar to the mean results of the E.coli as again the best temperature for micrococcus luteus bacteria to grow in is 20 degrees. At 35 degrees there was bacterial growth but not as much at 20 degrees but had more growth than in 4 and 60 degrees. The least temperatures for micrococcus luteus to grow in were at 4 and 60 degrees due to the same reasons for the temperature of bacterial growth of E.coli. At 4 degrees it is too cold for the bacteria to grow and slowed down their reactivity therefore making no production of growth and at 60 degrees the temperature is too high for the growth of the bacteria which they would of become killed or denatured this mean no growth of bacteria.
Calculations
To work out the mean of the effects of temperature and pH of growth of bacterial looking at the table of results, within each column the data is added together and divided by the number of results within that set this is shown below.
Bacteria Eschericha coli temperature at 4 degrees
-0.05+0.01+0.04+-0.06+0.06+0.01+0.04+0 = 0.05 therefore 0.05 divided by 8 equals = 0.01 which is the mean at 4 degrees of the bacteria Eschericha coli
This calculation is applied to the other results to work out the mean of the temperatures and pH’s
Factors effect growth of bacteria
Liquid nutrient broth is used for growing the bacteria which are e.coli and micrococcus luteus. Within this broth it contains all the nutrients in which the bacteria can survive and reproduce in. Before measuring the absorbance of the two bacteria’s in liquid broth each test should start off with the absorbance of the liquid broth by it self as this would standardise the colorimeter to read at 0.00 absorbance units. In this experiment a green filter is used in the colorimeter which it is at a wavelength of 520 nm. This green filter is used because it is the best wavelength of light to absorb the solute which is the liquid broth containing the bacteria. This would increase its accuracy.
There were some controls done within the experiment one of them was using aseptic techniques such as sterilising bench with ethanol, washing hands, using sterilised equipment and going through a flame with the lid of the test tube to remove bacteria within the air. All these techniques reduce the amount of other bacteria that is not needed in the experiment and minimize errors within the results. Another control procedure is placing one drop of bacteria within each nutrient broth and using the same equipment which was the glass pipette to make sure the volume of the bacteria is delivered. Each tube had the same amount of nutrient broth volume for which the bacteria was able to grow in. These bacteria’s were controlled at certain times as they were incubated for three days therefore a total of 72 hours. The same instrument was used to measure the absorbance of both bacteria and the same colour filter with was green at a wavelength of 250nm.
There were some variables within the experiment one of them was the temperature. For the bacteria’s of pH experiment all four bottles were incubated at 24 degrees as for the bacteria of the temperature experiment each bottle was incubated at different temperatures of 4, 35, 60 and room temperure which these temperature were not controlled therefore would give different results but however the pH of the nutrient broth of the bacteria from the temperature experiment was the same. Another variable in the experiment was the absorbance of each nutrient broth since both experiments pH and temperatures were at different values to see which pH and temperature value best to grow in so these were not kept control.
When measuring the absorbance of each nutrient broth, the test tubes are needed to be the same thickness but not thick as this can cause errors with the results. Once the colorimeter had read the absorbency and gives a positive reading this shows that within the nutrient broth there is no growth of bacteria therefore this would give a less absorbance reading. This need to be controlled to give accurate results if not it is account as a variable.