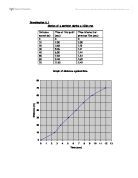
At 0 seconds her speed is 0 ms-1.
At 1 second her speed is 3.6 meters per second per second, this is her acceleration in the fist second.
Acceleration= change of speed per second (ms-2)
During the last part of the run the runner is slowing down this could be because she is getting tired. It could also be that she can see that she is reaching the end and so she stops trying as hard and begins to stop so she does not have to run past the last cone.
Speed at 2 seconds from the end of the run = 6.0
Speed at the end of the run = 4.13
Deceleration = change of speed per second
Deceleration = 6.0 – 4.13
Deceleration = 1.87 ms-2
Newton’s second law of motion,
Force (in newtons) = mass (kg) x acceleration (ms-2)
45 x 3.6 = 162 newtons, this if the force at the start of the run
The forward force acting on the runner is from the quadriceps, hamstrings, gastrocnemius and the weight of the runner.
Friction helps the runner to accelerate quickly as it allows her to grip the ground and push off from the ground.
The scales read more than my weight when jump off them because I am applying more force on them from the muscles in my legs.
Newton’s third law of motion is that for every action there is an equal and opposite reaction.
This means that when the athlete pushes hard against the ground during the start, the ground pushes back on the runner with an exactly equal force, but in the opposite direction.
Near the end of the run when the runner is moving fastest there is more air resistance acting on her it is greater when she is moving faster.
Fluid forces are caused by air and water, when an object moves through water or air it is affected by fluid friction which acts in the opposite direction of the moving body. The amount of air resistance of fluid friction experienced depends upon the shape of the object and the speed at which the object is moving.
Air resistance affects most sporting activities, although its affects on performance differ. Air resistance can affect the performer in flight e.g. long jump, Projectiles such as balls, shuttle cocks and javelins, Cyclists and Sprinters.
Air resistance on a projectile while in flight may change the parabolic flight path. These are the expected flight paths on different projectiles:
Flight paths can be categorised as:
- Parabolic (a uniform symmetrical shape)
- Nearly parabolic
- Asymmetrical
Flight is governed by the ratio of weight to air resistance. Air resistance is dependant on the size, shape and speed of an object, so all slow moving objects have little air resistance. Faster moving objects have greater air resistance. This causes rapid deceleration and slowing down of the projectile until a point is reached where weight becomes the determining factor, leading to an asymmetric flight path.
The shape of an object also affects the air resistance acting upon it. Objects that have an even shape such as a football, travel slowly through the air and the layers of air flow past the object in smooth symmetrical flow lines. This is called laminar flow. This does not happen on fast moving objects because as air travel around the object the layer of air directly in contact with the object’s surface is slowed down by surface friction. On a fast moving object, the air is unable to keep in contact with the surface and breaks away to form fast moving swirls of air. This is called turbulent air.
Because the air is fast moving at the back of the object, it has relatively low pressure in comparison to that at the front of an object. This causes a force pulling the ball back, since objects will always move from an area of high concentration to an area of low concentration. This is called drag. In speed sports drag must be minimised and this is done by streamlining.
At the end of the run there will be less force acting on the runner than at the start of the run as she is moving at a nearly constant speed at the end, while at the start she has to move off from a still position. She is accelerating at the start of her run so according to Newton’s first law there will be a net force acting on her.