The controlled variables are all other aspects of the experiment and need to be kept the same to ensure that the method used will produce fair and accurate results.
These controlled variables include:
-
Amount of solution for each concentration for each boiling tube (25 cm3)
- Scales used to measure the chips is the same
- Temperature of the atmosphere in which the investigation takes place, (room temperature) controlled by carrying it out in the same location each time
- Surface on which the investigation takes place, level bench
- Length of time in which the chip is submerged in the solution, 120 minutes
- Same brand of potato used to cut chips, Red Rooster
- Size of potato chip 10 millimetres in diameter by 40 millimetres in length
- Same size boiling tubes
- All boiling tubes covered to prevent condensation
- Core borer is the same size
- Time of insertion and extraction of each chip, to and from each boiling tube will be carried out simultaneously
Also in this investigation the experiment will be carried out three times. This will help to ensure the reliability of the results and to reduce any random errors that may occur during the experiment. By taking their average the most accurate value can be derived.
The preliminary work, is as important as the actual experiment, as it allows for a hypothesis to be made and may give an idea of possible changes within the variables before performing the actual test.
An experiment was held using the same method and apparatus but the ranges of concentrations used were 0%, 1%, 2%, 3%, 4%, and 5%. The experiment was held only once with one chip in each solution. The potato brand used was Maris Piper potatoes and the chips were cut to about 40 millimetres in length. After conducting the preliminary experiment the following results were recorded below.
Table 1 Data recorded from the preliminary experiment
The results from this test show that only the zero percentage concentration caused the potato to draw water in through osmosis, the amount was also very low allowing for the presumption that these particular potatoes did not contain a high level of sugar therefore have a low level water potential within their cells. With an increase in concentration a decrease in mass was shown for the chips, proving the solutions to be hypertonic. Percentage concentrations over 2.5 are most certainly too strong to be anywhere close to an isotonic solution. On this basis, the decision to have a narrower range of concentrations was decided, 0.0% up to 2.5%, this will provoke a more accurate set of results to determine the isotonic solution. Also the brand of potato used would be changed in the hope of a better sugar concentration in their cells.
Also noticed in the preliminary results were discrepancies in the last three percentages, this anomaly is probably due to either human error or invalid variables. Doing the experiment three times helps to prevent this from happening as well as following the instructions explicitly.
After the results are recorded some calculations will be carried out.
- Change in mass
- Percentage change
- Mean percentage change
These numbers will be used to plot a graph so the information can be analysed easily and a percentage figure for the isotonic solution can be seen.
Hypothesis
The prediction for this experiment is that as the concentration of the solutions increase the mass of the potato chips will decrease.
Equipment
- NaCl (salt)
- Distilled water
- Potatoes
- Potato peeler
- Cork borer
- Knife
- Safety blade
- Measuring cylinder
- 18 Boiling tubes
- Marker for labelling
- 3 Racks
- Para film, 18 squares
- Stop clock
- Cutting tile
- Top pan balance
- Paper towels
Method
- Collect all materials listed above
-
Make up 100cm3 of each of the salt solutions using information from table 1 below
- Label three boiling tubes 0.0%
- Repeat step three for each of the other concentrations
-
Measure out 25cm3 of 0.0 solution and pour into the labelled boiling tube, repeat for the remaining two tubes labelled 0.0%
- Now repeat the previous step for each of the remaining concentrations
- Peel the two potatoes
- Cut 18 cylinders of potatoes and trim to five millimetres in diameter and 40 millimetres in length
-
Weigh one cylinder and note its mass in grams, record in table labelled initial mass, place into the boiling tube labelled 0.0%, repeat twice for the remaining tubes labelled 0.0%
- Repeat step nine for each of the remaining concentrations
- Seal all the boiling tubes with para film and leave for two hours at room temperature
-
After two hours, beginning with the 0.0% boiling tubes, one by one remove the potato chips and pat dry with paper towels, weigh and record the mass in column labelled final mass
- Repeat step 12 for each boiling tube concentration
- Calculate the change in mass for each of the concentrations and record in the processed data table
- Calculate the percentage change in mass for each concentration and record in the processed data table
- Calculate the mean percentage change for each concentration
- Plot a graph; mean percentage change vs. Concentration
Table 2 Range of concentrations of salt solution
Risk assessment
Safety is an important aspect in every experiment, even if the experiment seems to be very harmless. Things to take into consideration are:
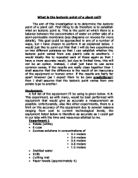
- Use of a very sharp knife to cut potatoes,
- Spillages can cause people to fall so they should be wiped up immediately
- Safety goggles should be worn at all times
- Bags lying around the floor can cause someone to fall so they should be kept away in a safe place
- Be careful of glassware
Results
Table 3 Recorded weight of potato, before and after experiment
Table 4 Data calculated from recorded weight
Table 5 Shows mean results for [% NaCl solute] vs. % change in mass
A graph has been created to visualise the trends in these results.
Discussion
On analysis of the results and the line graph a similar trend to that of the preliminary results can be seen. It is also obvious that the isotonic solution is within the range of 0.0% to 0.5% making accuracy in this experiment extremely difficult to achieve. Therefore the concentration ranges would have been better set around these percentages with results determined from different concentration gradients taken between them.
The specific trend visible in the graph is a dramatic decline, dropping from a positive increase in mass to a negative decrease in mass. Proving again that the water potential within the potato cell was negative but only slight as the intake of water down the gradient was minimal. The solution was hypotonic until the next concentration percentage, 0.5% where the change in mass is negative, this decrease continues dramatically with a rapid decline in mass between 1.0% and 1.5%. From these results it is easy to gather that the potatoes were similar to that of the potatoes used in the preliminary experiment which contained low sugar content and low water potential.
When referring back to the hypothesis, the prediction for this experiment was that as the concentration of the solutions increased the mass of the potato chips would decrease. This is a correct analysis with the results in the graph supporting the prognosis.
The most significant part of the graph is the point at which the line cuts the X axis. This shows the percentage of sodium chloride concentration that would have had a zero percentage change in the mass of the potato chip, 0.43%, giving rise to the percentage for the isotonic solution. To produce an isotonic solution per litre the amount of grams of salt needed are calculated below:
-
0.43% concentration of NaCl per 100cm3
-
0.43g + 99.57cm3 = 100cm3
- Multiply by 10 to bring amount to litres
-
4.3g NaCl + 995.7 H2O = 1 dm-3
For Mr Chips and his chip shop, this investigation concludes that the amount of salt needed to achieve an isotonic solution is 4.3g NaCl + 995.7 cm3 H2O.
On evaluation of this investigation a number of aspects came to light. Firstly the potato, the Red Rooster are low in sugar with about 1 g to one potato, a better brand may be golden wonder as the potato is described as the fluffiest and could contain a higher percentage of sugar. Also the potato may be a little out of season at the time of the experiment thus influencing the sugar content. A further experiment with a variety of potatoes may help put this debate to rest.
The potatoes were cut into cylinders, not chips, giving a different volume to surface area ratio; rigid cut slender chips may give better results, though this could give rise to human error.
Scales used for weighing potato could be more modern or accurate.
Time of insertion and extraction of each chip to and from each boiling tube is near impossible to be carried out simultaneously, an unfortunately difficult problem to resolve.
With excess water on the potatoes, paper towels were used to dab of the excess. However, in doing this water could have been removed that was not excess, and altered the results. Alternatively, a quick shake to remove excess drips of water and then weigh.
Conclusion
As the concentration of the solutions increased the mass of the potato chips decreased. At the point of 0.43% concentration equilibrium was met with the solute and the potato cell contents. The amounts of grams required are 4.3g Sodium Chloride plus 995.7cm3 of water to make a litre of solute.