Hypothesis
In my introduction I stated that the lower the concentration the less starch is present. Therefore, there is lower number of collisions and the chance of the substrate and enzyme colliding is less. The higher the concentration the more the starch is present. Therefore, there is higher number of collisions and the chance of the substrate and enzyme colliding is greater.
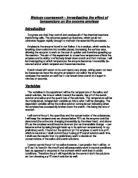
The above graph shows my secondary source of data from ‘Advanced Biology Principles & Applications’. At lower substrate concentrations the rate of reaction increases in direct proportion to the substrate concentration, but at higher substrate concentration the rate of reaction becomes constant and shows no increase.
The reaction of the enzyme forming a complex with the substrate is likely to be slightly faster than the reaction of the complex breaking down to release the product. As the substrate concentration is increased the number of active sites rise. Further increases in substrate concentration would not be able to speed up the initial rate of reaction.
In solutions of higher concentration, particles are closer together. Therefore, they have a greater chance of colliding. This is because there are more collisions, so the reaction rate is greater.
The catalyst seems to lower the activation energy for the reaction. Many collisions are greater and the reaction is faster.
Although the theoretical maximum rate (Vmax) is never obtained, there does come a point when no matter how increased the concentration of the substrate becomes, the reaction rate will stop increasing. This happens because the active site of the enzyme molecules at any certain moment becomes virtually saturated with substrate concentrations. This means that the additional substrate has to wait until the enzyme complex has released the product before it may itself enter the active site of the enzyme. This explains the curve of the graph of substrate concentration.
The effects of high temperatures, extreme pH values and inhibitors are best explained in terms of altering the tertiary structure of the enzymes molecule so that the substrate is unable to combine with the active site.
As the temperature increases the enzyme and substrate molecules will have more kinetic energy. They will move faster and collide more frequently. This will increase the rate of reaction. The enzyme is then denatured at a certain temperature. The shape of its active site has altered and the substrate no longer fits. The rate of reaction will decrease. Temperature, in terms of room temperature, shall affect my experiment.
From looking at my background information I can now predict that by increasing the substrate concentration the rate of reaction will also increase. At a certain point, using a certain percentage of concentration the rate of reaction will no longer increase. This is because the Vmax will not be obtained. The substrate molecules will not be able to combine with the active site. Therefore, the graph should be curved. The 1.0% concentration will digest the enzyme much faster than the lower concentrations.
Fair testing
To ensure that my experiment is fairly carried out I should do the following:
-
I should not give priorities to one solution only. What I mean by this is that I should put an equal amount of each solution.
-
Avoid air bubbles as it can cause inaccuracy of results.
-
The apparatus should be washed with distilled water before and after use.
-
To get the same amount of concentration a pipette should be used.
-
The experiment should be carried out away from the window to prevent extra heat reaching the solution as temperature can affect the rate of reaction and the results. Carrying out the experiment near a window will change the temperature.
-
The same apparatus should be used for each experiment i.e. the beaker size should be kept the same.
A measuring cylinder is an object for measuring liquids only. You cannot use the measuring cylinder to mix liquids. In this case, you cannot put a concentration in it and then put iodine in it as well to mix it. You should not put amylase solution in with the concentration, as the reaction would start immediately.
When you see that there are air bubbles in the pipette you should rinse it and get some more of the same concentration in the pipette. DO NOT put the concentration back into the test tube containing that concentration. By doing so the concentration would become contaminated.
You cannot do some aspects of fair testing properly. For example, when getting the same amount of solutions, using a measuring cylinder, there is always a tiny drop left. Therefore, the experiment will have limitations.
Preliminary work
My first two practicals went wrong. The first practical was carried out near a window. As I stated in my fair testing, experiments should not be carried out near a window as this allows extra heat reaching the solutions, which in turn affects the rate of reaction. Then I realized that this would affect my results. When I had recorded my results I found that the lowest concentration used was darker than usual.
The second experiment had also gone wrong because the pipette had contained an air bubble. When I recorded my results I found that the solutions were lighter than usual. I also found the way I recorded my results inappropriate. This is because they were not accurate enough. Below shows how I used a table to record my observation.
This is not accurate. It only provides a vague idea because of the different shades of colours.
In my preliminary work, I used a beaker to heat the starch and amylase enzyme to a temperature of 37°C (because it is body temperature). However, this did not keep the temperature constant. Therefore, in my experiment I shall use a water bath.
In my preliminary work I did the above. Therefore, I am going to carry out the experiment fairly, making sure that I do not do what I did as mentioned in my previous practicals. To record reliable results I shall give a colour coding with arbitrary units. This will be more accurate than the above table because it will be helpful when I repeat the experiment.
Safety
- Carry all substances with care.
- Remove loose clothing and tie back loose hair.
- Wear a lab coat, safety goggles and gloves.
- Avoid getting chemicals on your skin. If you do then immediately rinse the affected area with cold water and seek medical attention.
- Amylase is a digestive enzyme. It can be dangerous if it gets on wounds. Therefore, avoid direct contact with it.
- Make sure that when you put iodine it does not get on your clothing as it can leave permanent stains.
- Do not swallow or drink any substances, as it can be very harmful.
- Do not eat or drink during any part of the experiment.
- When using matches, be sure to handle them with care.
- If a bottle of a chemical is broken on the floor immediately locate and contact the lab technician.
- After the experiment ensure to wash your hands thoroughly before touching any part of your body.
- Do not run around in the laboratory and make sure all bags are underneath the tables.
Variables
Apparatus
- Test tubes
- Test tube rack
- Iodine solution
- Pipette
- White tile
- Amylase enzyme
- Starch (0.2%, 0.4%, 0.6 %, 0.8% and 1.0%)
- Water bath (set at 37°C)
- Stopwatch
Method
Step 1: Put the different concentrations into 5 different test tubes,
using a pipette.
Step 2: Put the amylase solution into the remaining test tube,
using a pipette.
Step 3: Put 2 drops of 0.2 % concentration into two parts of the white tile, using a pipette. Label the parts.
Step 4: Put one of iodine into the row of the white tile.
Step 5: Get a stop watch ready.
Step 6: Put 2 drops of amylase solution in the parts of the white
tile, where the concentration has been put, mixing it as you go along and rinsing the pipette after mixing each same concentration. Start the stop watch.
Step 7: Time the experiment and note down the results in arbitrary units
for each part of the white tile.
Step 8: Repeat steps 3- 6 for 0.4%, 0.6%, 0.8% and 1.0% concentration. This should therefore give you two sets of results for each concentration for accuracy.
Step 9: Record results at 2-minute intervals for 10 minutes.
Observation
I recorded my results at regular intervals of 2 minutes for 10 minutes. My observation has given me the following results that I am going to give in terms of marks out of 10:
At 2 minutes
At 4 minutes
At 6 minutes
At 8 minutes
At 10 minutes
The following table is a simplified version of the table of results above:
Keys for the arbitrary units
The following show how I got my results for marks out of 10:
1
10
2
10
3
10
4
10
5
10
6
10
7
10
8
10
9
10
10
10
Analysing Evidence
When looking at the concentration of 0.2%, you can clearly see that the reaction did not reach digestion within 10 minutes. This is also the same case for the concentration of 0.4%. We know that these are low concentrations so the reaction was slower. This was because there were not enough substrate molecules to occupy all the amylase molecules. Concentrations of 0.6% and 0.8% have very similar results. The only change in those results came at 6 minutes. The results then kept the same for 8 and 10 minutes. From the results, we can see that 0.6%, 0.8% and 1.0% concentrations had digested the amylase within 10 minutes. 1.0% concentration had digested amylase quicker than 0.6% and 0.8% concentrations. This was because 1.0% is a high concentration. Therefore, there must have been full substrate molecules that occupied all the amylase molecules.
In my graphs I have drawn the line of best fit and then worked out the gradient in order to find the rate of reaction. In my rate of reaction graph I came across two anomalous results. The reason for this may be that the results that I took were accurate as I compared the colours to the key of colours. However, the results could have been more accurate if I took closer up photos during the experiment and then scanned them onto computer and then give them arbitrary units according to the resolution. Therefore, I would get more accurate results for my concentration graphs. In turn, this would give me an accurate gradient, which would give me an accurate rate of reaction graph.
From the rate of reaction graph we can see that there is a steep increases but then it is slowed down, where 1.0% concentration has the higher rate of reaction. This can be explained by referring to my hypothesis. As already stated, the curve of the graph is due to when there comes a point when no matter how much you increase the concentration of the substrate, the reaction will stop because the active sites of the amylase molecules at any certain moment become virtually saturated with substrate at high concentrations.
Conclusion
The aim of my experiment was to find out if there was a relationship between the concentration and the rate of reaction. By looking at my results I can tell that there is a relationship between the concentration and rate of reaction. As the concentration increases the rate of reaction also increases but then stops due to the Vmax never being obtained. The lower the concentration the less starch is present. The higher the concentration the more the starch is present. I have proved this by doing my experiment. When iodine is added to the solution to see if starch is present, higher concentrations show a richer colour of blue/black than lower concentrations
My hypothesis and secondary source of data from ‘Biology Longman Study Guide’ supports my results by producing a straight-line graph. Although the points are not in perfect line it is sufficient enough to draw a line of best fit. What I predicted was proven to be correct and is shown in my analysis of results and in my graphs.
Evaluation
I took a good range of readings to make my results more accurate. By comparing both sets of results I can conclude whether my first and second set of results were accurate or not. The only disadvantage of having repeated the experiment is that not everything would be the same. The amylase solution and concentration would be the same but it might be contaminated or the exact amount of solutions that I would have done in my previous experiment would not be the same in the present one. I should also record all the results at the right time. By this I mean that at exactly 2 minutes, for example, I record the results for all the concentrations at the same time, not a few seconds later. This I did not do. My preliminary work went wrong due to the reason that I did not think about my fair testing. In my rate of reaction graph I came across two anomalous results. The reason for this may be that the results that I took were accurate as I compared the colours to the key of colours. However, the results could have been more accurate if I took closer up photos during the experiment and then scanned them onto computer and then give them arbitrary units according to the resolution. Therefore, I would get more accurate results for my concentration graphs. In turn, this would give me an accurate gradient, which would give me an accurate rate of reaction graph.
The results, however, would still not be as accurate as I would like them to be. This is because I will not be able to put the amylase in all at the same time so there will be some variation in the time.
As I stated in my fair testing I cannot improve my experiment properly because when measuring concentration or amylase solution there is always a drop left when putting it in a test tube. Therefore, the amount of the concentration or amylase cannot be accurate.
I did not get an odd result whilst doing the experiment. However, my results are enough to make a firm conclusion. Although, they are not as accurate as they can be.
To improve the investigation further I would provide more time to see exactly when the 0.2% and 0.4% concentrations reach digestion. By this I would be able to see, which one out of them will reach digestion faster. It is very likely that 0.2% will reach digestion faster than 0.4% concentration. This is because it is the lowest concentration used. I could also investigate the effect of temperature and the minimum amount of the enzyme for the reaction to proceed at a faster rate.
Bibliography
Workout Biology GCSE
O.F.G. Kilgour
The Living World
Second Edition
Michael Roberts
Biology GCSE edition
Geoff Jones and Mary Jones
Advanced Biology Principles & Applications
C J Clegg and D G Mackean
Internet