[CH3COOH] = [CH3COO-] = [H3+O]
And as:
Ka = [CH3COO-] [H3+O]
[CH3COOH]
Therefore:
Ka = [H3+O]
Or:
pKa = pH (at ½ equivalence point)
Or:
pH = -Log10 Ka
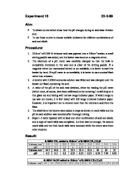
Prediction
I know that the curve for a weak acid/strong alkali should start higher up the axis than a strong acid/strong base curve. This results in the vertical section of the graph being shorter and due to salt hydrolysis, the curve will rise to 14 far quicker than it should. This is due to the following mechanism:
CH3COOH + NaOH → CH3COONa + H2O
CH3COONa → CH3COO- + Na+
H2O→ H+ + OH-
The H+ ions will then combine with the CH3COO- ions to produce CH3COOH:
H+ + CH3COO- → CH3COOH
The removal of H+ ions leaves OH- ions in excess. This excess of dissociated OH- ions leaves a strongly alkaline solution as the solution has the composition of NaOH with Na+ and OH- ions in solution.
Although my equivalence point should be at exactly 25cm3, this may not work out experimentally due to variations in the concentrations of the acid and alkali and inaccuracies associated with the use of a pH meter which may well be wrong by the same amount every time, thus creating a set of results either higher or lower than they should be.
Results
Calculation to find Ka
Equivalence point = approximately 8.8
½ equivalence point = approximately 4.4
At ½ equivalence point:
[CH3COOH] = [CH3COO-] = [H3+O]
As:
Ka = [CH3COO-] [H3+O]
[CH3COOH]
Therefore:
Ka = [H3+O]
Or:
pKa = pH (at ½ equivalence point)
Or:
pH = -Log10 Ka
4.4 = -Log10 Ka
Ka = 10-4.4
Ka = 3.9 x 10⁻⁵
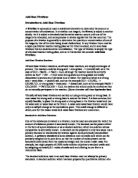
Conclusion
As I predicted the graph started higher up on the pH scale than that of a strong acid/strong base titration, and the vertical section was shorter and it rose to 14 more quickly than it should due to salt hydrolysis. I was also correct in assuming that the equivalence point may not be exactly 25cm3, as in actual fact it was around 28cm3. This can be explained by errors in the pH meter, and slight variations in the concentration of the solutions of CH3COOH and NaOH. I calculated the acid constant (Ka) or the concentration of hydrogen ions [H3+O] to be 3.9 x 10⁻⁵ that seems reasonable having checked the calculation.
Evaluation
Although I have obtained reasonable results, I feel there are several ways in which my results could be improved. The pH meter I used, despite taking quick readings was not the most accurate possible. If I wanted to improve the overall accuracy of my results, I could use a more accurate pH meter that remained accurate after calibration, a problem I encountered with my pH meter. Furthermore, although I can blame my pH meter for inaccuracy in my pH readings, it is more likely that the inaccuracy in the equivalence point is due to slight differences in the concentration of the acid and alkali. This is a problem that is difficult to remedy as I was provided with the solutions of 0.1M sodium hydroxide and 0.1M ethanoic acid. However, if I made up these solutions accurately myself, I would have more control over the accuracy of the concentration. If I eliminated these errors, I think my experiment would be near perfect. I could use phenolphthalein to show the exact point at which the graph goes vertical using the colour change. This would be beneficial as it would back up my pH readings and enable me to calculate the equivalence point more easily.