Fair test
- Repeat the experiment 3 or more times to increase the reliability of the data, but due to a time restriction the experiment can only be repeated twice.
- Take the chips out of the sucrose solutions in the same order as they were put into the test tubes, because this means they will all stay in the solutions for the same amount of time.
- Cut the chips so they have the same surface area for osmosis to occur, making the results more reliable.
- Blot dry the chips so as not to add extra mass.
- Each time you weigh the chips, re-zero the top pan balance.
Prediction
I predict that as the molarity of the sucrose solution increases the potato chip will loose mass. The chips which are placed in the 0 molar to about 0.125 molar will increase in mass because the solution has a higher water potential than the chip, and water moves from an area of high concentration to an area of low concentration via a partially permeable membrane.
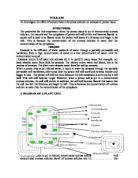
So the chip in the lower concentrations will become turgid because the water molecules will move into the chip forcing the cytoplasm against the cell wall by the vacuole, and those chips put into the higher concentrations of sucrose solution will become plasmolysed, because the water molecules will move into the solution because the solution is the area of lower concentration, so the vacuole will loose water by osmosis and shrink, pulling the cytoplasm away from the cell wall.
Obtaining evidence
Results
First experiment:
Second experiment:
Combined results to give the average percentage change in both experiments
Analysing and considering evidence
The graph shows the line of best fit for the average percentage change in mass of the potato chip over two experiments, each being forty five minutes in length. The graph is a curve that slopes downwards and does not go through the origin. Because the line is not straight and does not pass through the origin, it means that the percentage gain and loss in mass and concentration are not directly proportional. However, there is a pattern on my graph, and this is, as the concentration of the solution increases, the percentage change in mass decreases.
Although the last solution being 1.25 molar sucrose, has a higher average than that of the 1 molar sucrose solution. This suggests an anomaly in my results, that either the other chips were not blot-dried to the same extent or that there was water on the chip and that it contaminated the sucrose and diluted the solution making it weaker, or that the chip cell has completely plasmolysed and that there can be no more water loss.
Another anomaly seems to appear with the 0.25 molar sucrose solution. It off sets the line of best fit, so it must have gained mass somewhere from water, or not the same amount of accuracy taken to blot dry it.
The curve in my graph become less steep as the molarity of the sucrose solution increases. This is because the potato chip is becoming as flaccid as it possibly can, and so the change in mass of each molar concentration is becoming closer and closer together. From the line of best fit that has been added in, it can be seen that most of my points were close to creating a perfectly smooth curve. This shows that my results are fairly reliable. My graph is as I predicted, apart from the anomaly that occurred in the 1.25 molar sucrose solution.
It shows that the potato cells increase in mass in solutions with a high water concentration and decrease in mass in solutions with a low water concentration.
When the concentration of the sucrose solution reaches above 1 molar, there appears to be no further water loss, suggesting that the cell is fully plasmolysed.
From the graph an estimate to the concentration of the potato cell can be made as 0.28 molar, as this is the point where the potato is not increasing or decreasing in mass, this is known as the isotonic point.
This is where no osmosis is taking place, both the potato and the solution have an identical molar concentration. The next point, 0.5 molar looses approximately 10.6 %. This shows that the water potential of the sucrose solution in the test tube is weaker than that of the potato chip.
The next sucrose solution after that, being 0.75 molar, looses approximately 15%, this shows that the 0.75 molar solution has a lower water potential than that of the 0.5 molar solution, this is continued in the results as the molarity of the solution increases until the sucrose solution becomes 1 molar, at this point the chip had lost on average 20% mass to that of it before it was put in the sucrose solution, this is the highest loss in mass on the graph, the next solution only lost 19% mass, this could be because the chip has fully plasmolysed and no more water could be lost, or transferred via osmosis.
This graph above shows a clear indication that there was an overall decrease in mass during the experiment.
Evaluating
The experiment was very successful in my opinion. I obtained a large quantity of very accurate results from which I was able to create informative graphs. I think I took easily enough results for the amount of concentrations that I was using, and the time that I used for the experiment to last was enough to allow sufficient osmosis to occur.
The range of concentrations was adequate but I would possibly create more concentrations if I repeated the experiment so that I would have more varied results, i.e. 0.10m, 1.15m, 1.35m, and so on. This way would have allowed me to also find out the isotonic point far more accurately as the one that I estimated is very approximate.
The cutting of the potatoes was the most difficult part of the experiment as although I was recording my results by mass, it could well have affected the surface area and so the overall rate of osmosis. If I were to repeat the experiment I would have possibly found a machine to cut the potato as it would ensure that all potatoes would be the same weight and dimensions. As well as the potato I could have found a more accurate way to measure out the solutions and to determine the molar concentrations. Perhaps I could have used a burette. This would ensure that I have an accurate amount of fluid in each test tube. I could also weigh each chip on a more accurate scale, e.g. not to 0.00g but to 0.0000g
There were not any out of the ordinary results, but some were not as close to the line as others. This is possible a human error.
When the potato chips were removed from the test tubes and dried I may well have dried some potatoes more thoroughly than others and so some would have more excess water, which would add to the mass. If the experiment was repeated I could find another way to dry the potatoes that would ensure that all were dried in the same way for the same time. However with all this said I think that the experiment was truly successful and I was very pleased with the complete comparison of my results with my initial prediction