- Measurement of discharging current by a microammeter
- The circuit as shown in Fig.2 was connected.
- The switch was closed for charging up the capacitor.
- The switch was open to discharge the capacitor through the variable resistor and the stop watch was started at the same time. The reading of the microammeter was decreasing.
- The time t was recorded when the reading of the microammeter I is decreasing in steps of 10μA. The readings were tabulated.
- A graph of the discharging current I against time t was plotted.
Data analysis and Results
- Measurement of charge by an electrometer
Tabulate the readings of Q against t.
From the data above, we can know that the time taken for the charge to decay from 1.0x10⁻⁸C to 0.5x10⁻⁸C(t1) is about 10s , and the time taken for the charge decay from 0.5x10⁻⁸C to 0.25x10⁻⁸C(t2) is about 12s.
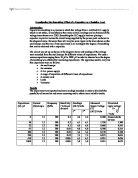
- Measurement of discharging current by a microammeter
Tabulate the readings of I against t.
From the data above, we can know that the time taken for the charge to decay from 100μA to 50μA is about 23s , and the time taken for the charge decay from 50μA to 25μA is about 23s.
Precautions
- In part A, we should ensure the reading of the milliammeter having a full-scale defection represent 1V.
- When we discharge the capacitor, the stopwatch should be also started at the same time.
Discussion
In this experiment, we are trying to plot a decay curve of charge in a capacitor and determine the half-life of it. From the graph which is obtained above, we know that t1 is very close to t2, this indicate the time for the charge to decay from 1.0x10⁻⁸C to 0.5x10⁻⁸C(t1) and from 0.5x10⁻⁸C to 0.25x10⁻⁸C(t2) is nearly the same, this also apply to the time taken for the charge to decay from 100μA to 50μA and from 50μA to 25μA.
For method A, since Q1/2 = t1/2 , we can know that the half-life of the capacitor is about 9s. And for method B, since I1/2 = t1/2, this can deduce the half-life of the capacitor is about 23s.
From the equation, Q=CV, since the 10-9F internal capacitor is used and it was applied by 1V, we can know that Q=10-9 C. And a 1010Ω internal resistor was connected up across the inputs of the electrometer.
By the equation,
It is the theoretical value of the half life.
The percentage error between the theoretical value of the half life and the experimental value in method A:
The percentage error between the theoretical value of the half life and the experimental value in method B:
The experimental value of the half life is larger than theoretical value in both methods, since there is some source of error in this experiment.
Firstly, there is error due to our reaction time when we start the timer. Since the reaction time of human beings is about 0.2s, it may cause the error in the experiment, and the reaction time of humans directly affect the experimental results.
Secondly, the experiment involves measurement error. The apparatus for measurement is not enough, for example, we just record the time correct to the nearest 1 s for using the stop watch.
When we compare the Q-t graph with the I-t graph, we can see that their shape are very similar, this can prove that the charge Q remaining in the capacitor at any time is directly proportional to the current I.
We also try to use a larger capacitance of the capacitor for the discharging, a larger time is used for the discharging process.
The time constant affects the rate of discharge of a capacitor. A smaller implies that the discharging process is complete in a short time. The capacitor is almost completely discharge when t = 5RC.
Conclusion
In this experiment, we try to study the process of discharging. We investigate the process of it and plot a decay curve of charge in a capacitor during a discharging process using an electrometer and a microammeter. We can determine the half-life of the capacitor used form the decay curve.
We compare the experimental value to theoretical value and find that the experimental one is a larger than the theoretical value, which is due to the error of this experiment.
It is also clear to see that t1 is very close to t2 for both 2 methods. we can know the relationship between Q and I, the charge Q remaining in the capacitor at any time is directly proportional to the current I.
We can improve the experiment by recording the time more accurately by taking more significant figure. We can also take more times of the measurement in order to obtain a more accurate result.
Reference
- New Way Physics for Advance Level – Book3(Fields, Electricity and Electromagnetism) ; Manhattan Press (H.K.) LTD, page 93-100