Physics GCSE coursework
Ray tracing
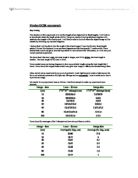
The objective of this experiment is to find the length of an object and its focal lengths. I will first try to hypothesize where the length points will be. The given results of my hypothesized diagrams will determine the lengths of the focal points. I will then be able to find out where the object image will be situated by following my ray trace diagrams.
I believe that I will be able to find the length of the object image if I can find the two focal length points ( 1/v and 1/u displayed in my ray trace diagrams and the focal graph). To achieve this I have decided that I could not get an accurate hypothesis if I did not know this information, so I will carry out a small practical experiment.

This is a preview of the whole essay
Peer Reviews
Here's what a star student thought of this essay
Quality of writing
Their spelling, punctuation and grammar is excellent throughout. However, there is room for improvement in the presentation of their report - for example they should have included better subtitles, a labelled diagram, and a method and results table for the preliminary experiment. However, they have used a simple table to clearly display their results and left space to include the graph in the report (rather than as an appendix), and have described the experiment very well, including precisely stating and explaining their hypothesis, analysis and conclusion, so their report reads fairly well.
Level of analysis
The author has shown some mathematical ability to manipulate their results by finding the mean. They have also used ray diagrams to come to their original hypothesis. However, they have missed the opportunity to investigate the power of the lens by using the lens equation (1/u = 1/v - 1/f where u is the distance from the object to the lens, v is the distance from the lens to the screen, and f is the focal length of the lens - so the power of the lens is 1/f). This could have been investigated by plotting a graph of 1/u against 1/v and finding the y intercept (1/f). When analysing their experiment, they considered some causes of uncertainties - the lack of precision of their measuring equipment, and the possible divergence of the light ray. In order to expand upon their evaluation they should have then suggested ways to reduce these uncertainties - be explicitly stating that they could use a more accurate ruler or laser measuring device, for example. Unfortunately the graphs and ray diagrams have not been included, but these would have gained them a lots of marks for analysing their data. It is important to include error bars on graphs, as well as labelling the axis clearly. The ray diagrams should be accompanied by the relevant calculations. Overall, their analysis of the data is fairly thorough, and should have gained good marks.
Response to question
The candidate has planned and carried out an experiment to investigate the relationship between the the distance an object is from the lens and the focal distance and size of image, and correctly identified a correlation. They have carried out a small preliminary experiment to come to a hypothesis, however they have not included the method or results for this experiment. The results of their main experiment were very accurate, and therefore supported their conclusion well.