The rate of exchange of substances therefore depends on the organism's surface area that is in contact with the surroundings. The requirements for materials depends on the volume of the organism, so the ability to meet the requirements depends on the surface area : volume ratio.
Variables
Dependent Variable: the dependent variable is the time taken for the pink colour to completely disappear form the agar as this depends on the diameter of the agar.
Independent variable: the independent variable is the diameter of the agar as this is what I will be changing.
Controlled Variables: These are what are kept the same to ensure that the experiment is a fair test. The concentration of the acid must remain the same because a higher acid concentration may diffuse faster. To stop this no other liquids other than the HCL will be added to the boiling tubes. The volume of acid in each boiling tube must also remain the same because a greater volume will result in faster diffusion due to the gradient of HCL inside the agar to outside the agar being steeper. The discs of agar must all be the same height because the diffusion rate will be slower if some are taller than others. My experiment is only being based on the diameter of the agar. The temperature must be kept the same also because if it is higher the particles will have more kinetic energy and diffuse faster. This will be controlled by a thermostatic water bath.
Prediction: I predict that the larger the diameter of the agar disc the slower the diffusion rate will be. This is because there will be less of the total volume that is exposed to the external environment.
Apparatus
1) Quantity of agar stained with phenolphthalein
2) Scalpel
3) Stopwatch
4) 5 boiling tubes
5) Supply of 2M hydrochloric acid
6) White tile
7) Five different sized cork borers
8) A syringe
Experimental Procedure
I would use the smallest borer to cut out a piece of agar. This would give the smallest diameter of agar. I would then place this in a boiling tube. Then using a syringe I would place 10cm3 hydrochloric acid into the boiling tube so that the “disc” of agar was completely submerged. I would then start a stop watch to time how long it was until the pink colour completely disappeared. I would record my result in a table showing the diameter of the agar in mm and the time taken for the pink to disappear in seconds. I would repeat the experiment with the four other cork borers recording these results in a table. I would also repeat the experiment twice to check the reliability of the experiment and to rule out any anomalies. Anomalies will be considered as results more than 10% away from the others which are the same size.
Table of Results
Diagram
Materials and apparatus
∙ Agar with cresol red, (an indicator: red in alkali, yellow in acid)
∙ HCl (Hydrochloric Acid), scalpels, tiles, boiling tubes, bungs, timers.
Instructions:
1. Place the gelatine block on a tile and use a scalpel or razor blade to cut 2 cubes of 10 mm sides (2 x 1cm cube).
2. Keep one 10 mm cube intact and cut the other in half.
3. Repeat the cutting operation as shown in the flow chart to give five blocks of the dimensions shown (on our sheet).
4. Half fill a boiling tube with dilute Hydrochloric Acid (HCl).
5. Note the time, starting with the largest block, drop all the blocks into the tube of acid and close it securely with a bung.
6. Tilt the tube to spread the cubes out along its length. Hold the tube horizontally and rotate gently to see the blocks from all sides. Do not warm the tubes in your hands.
7. Obverse and record the diffusion of the acid to the centre of each block as indicated by the disappearance of the red colour.
Our Results:
Calculations:
surface area = (length x width) x 6 sides
volume = length x width x height
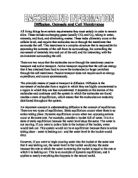
Conclusion
As we can see from the results - the diffusion of acid into the centre of the cell takes longer with the increasing size of the blocks.
We could watch how the blocks got yellow after the certain times (see results). It depended on their size after what time they were not red any more. The blocks are made of agar with cresol red. It works as an indicator as it is red in alkali and yellow in acid. Placing the different sized cubes in the tube filled with Hydrochloric acid starts the reaction with the agar in the acid. Because of the different surface areas the cubes do not get yellow at the same time – the smallest block gets yellow, the fastest and the largest block, the slowest.
The surface area to volume ratio is important because it is one of the factors that determine how quickly substances can diffuse into and out of the cell. In this way, the largest block has a big volume, but a not proportional big surface area. So there is less surface for the acid to diffuse into the centre of the cube and it takes longer. The smallest block has in proportion to its small volume a big surface area. In this way, the acid has a large surface to diffuse into the centre of the small block and takes less time to get yellow.
Diffusion becomes less efficient as the surface area does not increase to an extent that would satisfy the increased demands of a larger volume block.
As the length of the sides of a cube increase then:
-Surface area and volume increase exponentially, volume increases at a greater pace, surface area/volume ratio decreases exponentially.
As block sizes increase, the surface area does not increase in proportion to the volume.
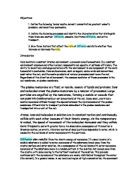
Interpretation: Each point on the graph below represents the surface area and volume for cubes that are increasing by one unit in length, starting with a cube with l = 1. The larger orange dot is the size of the cube (l = 6) at which surface area and volume have equal values (although the units are different to one is units2 and one is units3). For cubes smaller than this, surface area is greater relative to volume than it is in larger cubes (where volume is greater relative to surface area).
Sometimes a graph that shows how the relationship between two variables changes is more instructive. For example, a graph of the ratio of surface area to volume, clearly illustrates that as the size of an object increases (without changing shape), this ratio decreases.
Mathematically, that tells us that the denominator (volume) increases faster relative to the numerator (surface area) as object size increases. The star on the line (at l = 6) represents the same point mentioned above: this is the size of the cube where S and V have equal values, and so the surface area to volume ratio is equal to one.
Evaluation:
This experiment is quite reliable as you can repeat it as often as you want and you get almost the same results. As we can see the results in each group were nearly equal. But you can notice that the end result of cube 1 (10x10x10) differs the most from those of the other groups, because we could not finish the experiment in the class. For this reason, we wrote down the average time of the complete diffusion for the acid into the middle of the biggest cube (advice of our biology teacher).
Problems that could arise are for example the inexactly measurement of time for the acid’s diffusion into the centre of the cube. It is difficult to watch the correct moment when this is happening. It could also be a difference in the size of the individual blocks, as we had to chop them up with a scalpel. It could have been occurred that the sizes of the blocks differed from group to group.