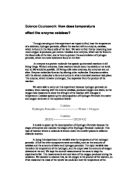
We measured how much oxygen was given off over 1 minute, repeating them 4 times per temperature [to get an average at the end], this was so we could see at which temperature the reaction was the fastest.
Prediction
I predicted that as the temperature of the hydrogen peroxide, at first, the reaction speed would increase, but as it reaches about 40ºC the reaction speed would gradually start to decrease. This is because enzymes, such as catalase, have an area, called the ‘active site.’ The shape of this determines whether or not the substrate will combine with it or not. At 50ºC the active site changes shape, the enzyme (catalase) would stop working, therefore the substrate (hydrogen peroxide) would not be able to combine with it. This temperature is called their ‘optimum temperature.’ At about 45ºC the reaction will have slowed down considerably, because the catalase will no longer be able to oxidise the hydrogen peroxide.
I also predicted that at 40ºC the reaction would be at its peak temperature for the fastest reaction. This is because generally, the speed of the chemical reactions, as temperature is raised. This is because as the temperature increases, the reacting molecules gain more kinetic energy and speed up. Also with the increased temperature the enzyme also tends to increase in reaction speed. At 37ºC the enzyme temperature is at the perf4ect point, therefore the enzymes’ active site is also the correct shape to combine with the substrate (see diagram below). This is its ‘optimum shape.’
The reactions rate should steadily increase when more substrate is added, this is because more of the active sites of the enzyme are being used, which results in more reactions, so the required amount of oxygen is made more quickly. Once the amount of substrate molecules added exceeds the number of active sites available then the rate of reaction will no longer increase. This is because the maximum number of reactions are being done at once, so any extra substrate molecules have to wait until some of the active sites become available.
Results
Oxygen collected (cm3)
From these results I was able to form a line graph, complete with a line of best fit, and labelled peak points, and where the rates of reaction dropped.
(See graph on next page)
Conclusion
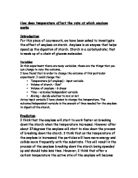
When the catalase in the liver, the enzyme, reacted with the hydrogen peroxide, the substrate, the chemicals began to produce a foamy substance around the liver. This is because the chemical reaction was taking place, therefore the catalase had begun to break down the hydrogen peroxide. As the catalase and hydrogen peroxide come in contact with each other the catalase enzyme would attempt to combine with the active site of the substrate, the hydrogen peroxide. This, in effect, oxidised the hydrogen peroxide, giving off the oxygen, through the delivery tube (see diagram below). As more of the catalase enzymes and substrates combined, the active site of the enzyme would being to change, causing the reaction to either slow, or stop completely (again see diagram below).
The oxygen at each temperature was produced faster due to the enzymes moving faster as the temperature increased, although once it reached its optimum temperature of around 36-45ºC the rate of reaction began to drop rapidly. This is because as it reached up to 50ºC the enzyme would stop working. Also as the active shape of the enzymes began to change during the reaction the substrate was no longer able to combine, so near to the end of the minute we timed the reaction begin to slow down. My results graph shows that the experiment had an ‘up-up relationship.’ As the temperature increased, the rate of reactions did too.
I predicted that at approximately 40ºC the reaction would be at its peak temperature for the fastest rate of reaction. My prediction was correct. If you look at the graph of our results you can see that the peak point it at approx. 37ºC. This is explained in the above diagram. Also one of the reasons for the reaction to speed up at the beginning was due to the fact that as enzymes heat up they gain more kinetic energy and speed up, this causes them to move around more (as shown in the diagram below), quickening the reaction rates. As the temperature increased, and the rate of reaction did, the active site would eventually reach its optimum shape. This is where the reaction is at its highest peak rate because the temperature and surroundings are perfect for it to react in. This is a 37ºC, as shown in my prediction.
If you take a look at my graph of results you can see the curve created by the results, the line of best fit. This agrees with my prediction graph.
At the peak point on both graphs, the prediction and results, virtually all the active sites would be occupied, so the active sites are said to be saturated with hydrogen peroxide. So attempting to increase the temperature of the hydrogen peroxide after the saturation would not cause the rate of reaction to increase any more. All the active sites were being used so any extra Hydrogen Peroxide molecules would have had to wait until an active site became available. The theoretical highest rate of reaction is when all the sites are being used but in reality this theoretical highest is never reached because the not all the active sites are being used all the time. The substrate molecules would need time to combine with the enzyme and to leave it so the highest rate accomplished is always slightly below the theoretical highest. The time taken to combine and leave the active site is the limiting factor in the rate of reaction. (Also shown on the bottom diagram on the previous page).
Evaluation
The experiment did follow the method accurately, and did turn out fair. We obtained the same, equal measurements throughout the experiment, and recorded the results accordingly. As we proceeded with each experiment 4 times, all together we carried out 20 experiments in total. This was to eventually get averages for each temperature. Even though the first 4 results varied between numbers, they still stayed around the same total, such as for the temperature of 20ºC the totals were:
15, 16, 16, 17, with an average of 16.
All of these results are around the same number, 16, and only
have a difference of 1 from the end average.
However with the temperature of 40ºC the results came out as:
24, 25, 20, 24 with an average of 24.
These results have a slight difference in the 4 experiments were the 3 experiment drops to 20, a difference 4 from the average. There isn’t a main reason for this, and isn’t not an accident, just maybe the reaction was not as effective this time, there is no way of determining how effective each experiment will turn out, or if it will be perfect.
Even though during the 20, in total, experiments we attempted to keep all variables, input and output, equal, it is impossible to keep every single variable precisely the same. For example; there would be a slight delay between pouring the hydrogen peroxide in, adding the liver, putting the bung on and starting the stopwatch. This will slightly affect all the results but as we carried out all the three steps in the same way for all the experiments it should not have made any difference to the overall result.
Looking on my result graph, my results are reliable to my line of best fit. The results have produced us a straight line of best fit to begin with, which then steadily turns into a curve dropping around the temperature of 40ºC. Although I have smoothed the curve out, the results do fit to the prediction graph, and the line does match up approximately to the plotted results on the graph. Luckily we didn’t come across any odd average results, so we didn’t have the problem of having to draw a graph with a sudden fall or peak in the results.
The experiments could be improved in a number of ways. It could be repeated more times to help get rid of any mistakes, which may have accorded. A better overall result would be obtained by repeating the experiment more times. The problem of the delay between pouring in the Hydrogen Peroxide, bunging the test tube and starting the stopwatch could have been limited by getting another person to start the stopwatch when the hydrogen peroxide was poured into the tube. But all in all I think we carried out, and proceeded with the experiments well to the planning.