I think that the rotary potentiometer sensing circuit will be better for this project as temperature will vary a great degree throughout the day and if the circuit were too sensitive the sensor would keep activating. The rotary potentiometer senses the occasions when the window slips so does not need to be as sensitive so will no activate continually.
Equipment
- 12V power supply
- Wires
- Rotary potentiometer
- Voltmeter
- Fixed resistor
- Crocodile clips
- Protractor
- Pointing device (Lego)
Circuit diagrams
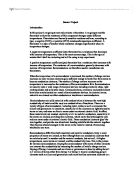
Method and set-up
This circuit is first constructed carefully and for safety reasons without the power supply switched on.
The rotary potentiometer will be connected to the circuit by two of its three terminals. A wire coming from the power supply through the fixed resistor connects to the first terminal. Then the second terminal is connected to the voltmeter, which is connected in parallel to the component, which is the rotary potentiometer.
The same fixed resistor is used thought out the experiments so as to ensure the variables remain constant. The resistor that will be used in the circuit will be a 10KΩ resistor, which has similar resistance to the rotary potentiometer. If the resistance of the rotary potentiometer is 10KΩ at its highest resistance the angle of the arm will be 3000 (as the arm does not turn a complete 3600). This can be used to show the rough resistance of the rotary potentiometer at different degrees.
The maximum estimated resistance for the rotary potentiometer in my experiment will be roughly 59994Ω as the maximum angle being measured up to is 1800 as a window would not be able to open wider than this. So there is not a stage in the experiment when the rotary potentiometer is has 0 Ω. In practise this is not the case as all components will have a certain internal resistance in some situations it is a benefit to have a low internal resistance.
Before results are firstly taken preliminary tests may be used to check that the circuit is working as expected. When taking preliminary tests the power supply should only give the lowest input voltage as possible as it is unknown at this point how the rotary potentiometer react to higher voltages. If the voltage is increased too high too quickly the rotary potentiometer may spark. During the preliminary tests for example the voltmeter may be reading a negative result, which is easily resolved by swapping the wires connecting to the voltmeter’s terminals. It is also important to ensure that the circuit does not short circuit. It is possible that the crocodile clips connecting to the rotary potentiometer touch each other and alter the readings. This can be avoided by placing a piece of paper between the two terminals.
As the readings are taken the rotary potentiometer arm with connected pointer (Lego piece) is rotated to certain degrees. The maximum the windows could open to would be 1800 so points up to and including 1800 can be tested for voltage change. Once certain the circuit is functioning and is safe to use then the voltage may be increased so as the results show larger difference, therefore the accuracy of the experiment depends less upon the accuracy of the voltmeter. The measured voltage change can then be used to find a number of different properties of the rotary potentiometer.
Firstly the sensitivity can be calculated using the formula;
Sensitivity=Δ Output
Δ Input
The sensitivity of a measuring system is the ratio of the change of output to change of input. In this case of this experiment the change in output is the change in voltage and the change in input is the degree interval.
We can then use this information to see if the sensitivity of the of the rotary potentiometer changes as the degrees increases. The sensitivity will be measured in the units V 0-1.
The resolution of the rotary potentiometer can also be calculated using the formula;
Resolution= Δ Output
Sensitivity
The resolution of the sensor refers to the smallest change the component can detect in the quantity it is measuring or the precision with which a measurement is made. Different resolutions can be calculated to see if there is a change in resolution throughout the experiment.
The angle cannot be tested with a protractor in this instance, so some type of marking system can be made up on paper showing the angles and the position for the rotary potentiometer. Then the experiments should be repeated three times to hopefully similar results. If any of the results seem to be anomalies then that experiment should be repeated to find a clear result. The anomalies result should however but noted and accounted for.
Hypothesis
I predict that the voltage will decrease with an increase in the angle size as preliminary rough calculations have shown that the resistance will increase as the angle increases. Voltage and resistance are linked to each other in Ohm’s Law which states that V=IR (Voltage equals current multiplied by resistance) so an increase in resistance means less current if flowing through the circuit therefore the p.d is lower so as the angles are changed at regular intervals the voltage will decrease accordingly in a linear fashion.
I also predict that voltage decreases in a linear fashion so I would expect there would be no changes in the sensitivity or the resolution throughout the experiment.
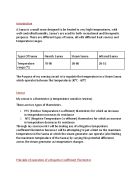
Results table
Now that results have been collected they can be plotted on a graph against number of degrees to identify any trends or anomalies results. To make the graph firstly the mean average (found by adding together the frequency of the data and number it by the number of pieces of data) of the results must be taken this decreases the chance of any singular anomalies results becoming apparent in the graph.
O0 Average= (5.25+5.29+5.26)/3 = 5.26V
200 Average= (5.15+5.18+5.15)/3 = 5.16V
400 Average = (4.98+4.92+4.93)/3 = 4.94V
600 Average = (4.73+4.69+4.65)/3 = 4.69V
800 Average = (4.41+4.37+4.37)/3 = 4.38V
1000 Average = (4.06+4.05+4.06)/3 = 4.05V
1200 Average = (3.93+3.87+3.86)/3 = 3.88V
1400 Average = (3.53+3.55+3.51)/3 = 3.53V
1600 Average = (3.20+3.23+3.22)/3 = 3.21V
1800 Average = (2.81+2.76+2.79)/3 = 2.78V
(See Graph)
The graph shows that as the degrees of rotation increase towards 1800 of rotation the voltage decreases in a linear fashion as predicated in the hypothesis through Ohm’s Law.
Now with the information available the additional properties of the rotary potentiometer can be calculated.
Sensitivity=Δ Output
Δ Input
Sensitivity=0.1
20
Sensitivity=0.005 V 0-1
This is the sensitivity at the beginning of the experiment
Sensitivity=Δ Output
Δ Input
Sensitivity=0.32
20
Sensitivity=0.016 V 0-1
Sensitivity at the end of the experiment (N.B 1800 of rotation has not been used, as it is clearly an anomalies result)
So from these calculations we can see that the sensitivity has changed by 0.011 V 0-1 which was not what was predicted in the hypothesis, however this difference may be explained.
Looking of the graph it is noticeable that the P.d at 200 is slightly above the line of best fit therefore could be assumed as a slightly anomalies result. If the value taken for 200 on the line of best fit is taken we may find a more accurate overall sensitivity.
Sensitivity=Δ Output
Δ Input
Sensitivity=0.26
20
Sensitivity=0.013 V 0-1
This result is similar to the result found for sensitivity at the end of the experiment, so this data shows that the sensitivity remains constant throughout the experiment.
The resolution may now been found from the sensitivity values previously calculated.
Resolution= Δ Output
Sensitivity
Resolution= 0.32
0.016
Resolution=20
This is the resolution at the end of the experiment.
Resolution= Δ Output
Sensitivity
Resolution= 0.26
0.013
Resolution=20
Resolution at the beginning of the experiment.
As predicted in the hypothesis the resolution value remains constant throughout the experiment when using the more probable result for sensitivity at the beginning of the experiment.