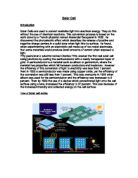
Silicon is has 14 electrons, meaning that its outer shell has only 4 electrons in and is half full. Therefore the silicon shares electrons with 4 other silicon atoms. This makes a crystalline structure. However this is poor for conducting because it has no free electrons. This means that the silicon must be modified before using it in the solar cell.
A silicon semiconductor contains impurities. When impurities are added to silicon, such as phosphorus, it makes the material a much better conductor. This is because the phosphorus has five electrons in its outer shell and not four. This means although the phosphorous still bonds with its neighbouring silicon atoms, there is one free electron which doesn’t form part of the bond. This means when energy is added that it is much easier to knock free a phosphorus electron because it was not bonded. This means that a lot more electrons break free than in pure silicon. These electrons can carry charge and are called free carriers. Making the silicon impure is called doping.
When the silicon is doped with phosphorus, it becomes N-type. This means that it is negative because it has more electrons. When silicon is doped with boron, which has only 3 electrons in its outer shell it forms the P-type junction (positive). There is a hole for each absence of an electron, which makes the silicon positive.
When the two P and N-type silicon are added together they mix and form a barrier at the junction between the two. This makes it difficult for electrons on the N-side to cross to the P-side. This makes equilibrium at the junction, with an electric field separating both sides. The electric field allows electrons to flow from the P-side to the N-side but not in the opposite direction. It allows the current to only flow in one direction, acting as a diode.
(The electrons can only travel from p-type to n-type)
Now when a light photon hits the cell with enough energy it will usually free an electron and a hole. If this occurs near the electric field the field will send the electron to the N-side and the hole to the P-side. This causes the neutrality to be disrupted and now electrons will flow back to the P-side, after being sent to the N-side, to unite with the holes. This will cause a current, and the cells electric field causes a voltage.
A solar cell is only able to absorb around 15% of the suns light energy, because the energy is not monochromatic, but of all different wavelengths. Some wavelengths will not have enough energy to knock free electrons. Therefore the energy just passes through. Some wavelengths have too much energy and only some is used to knock free electrons and the rest is lost. This accounts for 70% of the energy loss. Other reasons for energy loss are the silicon’s high internal resistance.
Some 5% of losses are saved by coating the semiconductor in antireflective coating. This is because silicon is shiny and therefore some energy would be lost due to it being reflected of the surface. This is stopped by the coating.
Aim
To investigate the factors which influence the output from a solar cell. I will choose the variables of how much voltage is supplied, and also the distance of the lamp to the solar cell. I have chosen these variables because I believe these the variables which will have the greatest effect upon the experiment, and will give us the best results. The results we achieve should hopefully be corresponding and systematic results, which will give us a linear graph.
Hypothesis
- I predict that as the distance between the lamp and the solar cell increases the output of the solar cell will decrease.
- Secondly I believe that as the power is increased the output of the solar cell will increase
Explanation of Hypothesis
1) The same amount of energy from the lamp will be given out throughout investigating this variable. However as the distance is increased between the lamp and the solar cell, the light intensity will decrease. This is because the concentration of light becomes more dilute the further away it moves from the lamp.
In a small area around the lamp the light will be concentrated and therefore give more energy to the solar cell. As the light energy moves further out it travels fills a greater area meaning that less energy reaches the solar cell as more the energy is spread throughout the surroundings.
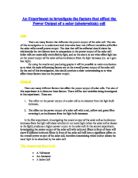
This diagram illustrates how the light intensity decreases as the distance is increased:
Area of a sphere = 4πr2
Given that the area of a sphere equals 4πr2 this diagram shows us that the further the distance the light must travel the bigger the distance it will encompass. It is evident from the equation for the area of a sphere that as the radius increases the area increases.
For example let r be 2:
4 π (r2) = 50.27 cm3
4 π (2r2) = 201.06 cm3
Evidently we see the area increases. Now if we consider this increasing area in the equation for intensity.
I = P / 4πr2 Intensity = Power / Area
Therefore if the power stays constant and the denominator, which is area, increases the intensity must decrease.
Secondly I have produced this diagram to show how as the distance increases the light rays spread out, therefore meaning the light intensity will decrease.
Both of these diagrams illustrate that the output of the solar cell should decrease as the distance between the lamp and the solar cell increases, because the light intensity of the lamp decreases with distance.
2) As the power increases the output of the solar cell should increase.
Power = Voltage x Current
Power is amount of energy which is transferred per second, and therefore if we increase the power the bulb will emit more energy per second. This will obviously mean that the solar cells output will increase as it receives more light to transfer to electrical energy.
The graph I would expect to achieve from my hypothesis would be an inverse square graph. This is because we can observe that area is proportional to distance squared using the formula 4πr2.
If we relate area is proportional to distance squared to this equation intensity = power / area, we will find that intensity has a 1/d2 relationship with the solar cell output. The inverse square law gives us a graph which looks like this:
If my results are accurate I would expect to obtain a graph which shows the same trend as this for the relationship between distance and solar cell output.
The graph I would expect to see for the power would be a straight line graph as the increase in light intensity from the lamp should be proportional to the increase in power. This can be explained by the increased amount of photons hitting a specific area of the solar cell. Therefore the solar cell will produce more current.
Apparatus
For the experiment we will require:
- 12 Volt lamp
- Variable low voltage supply
- Solar cell
- Digital voltmeter & digital ammeter
- 0-100 milliamp ammeter
- Meter rules
- Wires
- Crocodile clips
Keeping the Experiment Fair
When testing the different input powers as a variable, I will keep constant the distance, temperature, frequency and orientation of the solar cell.
When testing the distance as a variable, I will keep the input power, temperature, frequency and orientation of the solar cell constant.
Method
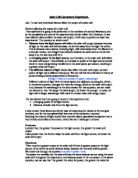
- Set up the apparatus as shown in the diagram
- I will check to make sure the constants are fixed to give fair results
- When testing the distance as a variable I will increase the distance by 2 cm each time up to 20cm, keeping the voltage fixed at 12V
- When testing the power input as a variable I will change the input power from 1V – 11 V, keeping the distance fixed at 5cm
- I will record each ammeter, voltmeter and mA reading
- Then repeat I will repeat each experiment to make sure that our results are reliable and not a one off fluke
Diagram
Evaluation
From the results I obtained there are no real anomalies. However any one of the results may have been slightly inaccurate due to human error whilst carrying out the experiment. For example when reading the display on the ammeter may have been misread. If we had of obtained a result which was lower than the trend line, this could have been caused by not all the light reaching the solar cell. For example if some of the light was blocked by an obstruction.
However in the graph for output power mA vs power out W, we saw that at the first results were quite flat and then curved into the straight line. This was unexpected as we expected the graph to be a straight line with no curves. The reason for this may have been the background lighting in the room, and this may have been eliminated if the experiment was carried out in a darkened room.
The experiment could be improved by repeating the experiment another time to show that the results were not random. Also our results may have been affected by factors such as the lighting in the room, light being blocked from reaching the solar cell, or human error. To improve the experiment I would carry the experiment out in closed conditions to prevent these problems discussed.
It would be interesting to investigate the effect of colours of light on the output of the solar cell for an extension experiment. We know different colour of spectrum have different frequencies. The higher the frequency, the shorter the wavelength and the more energy the photon will carry. Therefore we would predict that the colours with higher frequencies hitting the solar cell would produce a bigger output. However in order to carry out this experiment we would require expensive equipment. In the lab however we could investigate the effect which coloured light filters have on the solar cell output. Colour light filters will only let the colour that it is through the filter meaning we would be able to test this variable.
The apparatus required for this experiment would be as follows:
Apparatus
For the experiment we will require:
- 12 Volt lamp
- Variable low voltage supply
- Solar cell
- Digital voltmeter & digital ammeter
- 0-100 milliamp ammeter
- Meter rules
- Wires
- Crocodile clips
- Colour light filters
Method
- Set up the apparatus as shown in the diagram in the planning section, but between the solar cell and the lamp will be a colour filter
- I will check to make sure the constants are fixed, such as distance and voltage, to give fair results
- I will place the filter in 2 cm between the lamp and the solar cell and position the lamp so all the light is focused at the filter
- I will record each ammeter, voltmeter and mA reading
- Then I will change the colour of the filter and repeat the procedure
- Then repeat I will repeat the whole experiment to make sure that our results are reliable and not a one off fluke