www.answers.com
Equipment :
- Beakers
- Measuring cylinders
- Measuring Syringes
- Enzyme (trypsin 0.5%)
- Milk powder solution (0.5% concentration)
Variables :
Independent
This is what we are testing, therefore what we are controlling.
Dependant
This is a dependant variable because it depends on the independent variable for its number.
Controlled
- temperature
- volume
The control variables are kept constant to ensure the validity of the results. If they were not constant something other than the enzyme concentration could have affected the time taken for the solution to clear. (For example, had the temperature for one experiment been higher than for another it may well have speeded up the reaction as enzymes work better at slightly higher than room temperature. Or if we had used different volumes then we would have been looking through different thickness’ of solutions and different concentrations as the water ensures that the milk powder solution and the enzyme solutions ratios stay the same.)
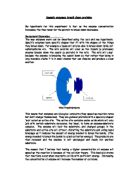
Method :
For this experiment we got several beakers filled with 5cm of milk solution, then we added different concentrations of enzyme, always keeping it the same volume (10cm ) by adding water. Then we watched and timed (using a stopwatch for accuracy) until the text (standard text) underneath the beakers with milk solution and enzyme was clear enough to read. We used a beaker with just milk solution and water as a control.
Results of enzyme coursework :
Rate of reaction :
The rates of enzyme-controlled reactions are measured by the amount of substrate used or the amount of product formed in a given time. For this experiment it would be sensible to measure how much product is used up as the volume of the mixture is kept the same throughout making it hard to measure how much product is formed.
When comparing the rate of reactions the initial rate of reaction is used. This is at the beginning of the reaction when it is happening rapidly and is measured as
1/T
where T is time.
So to work this out we must make another table.
Analysis :
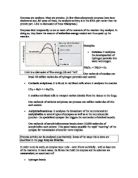
The graph of time against concentration shows a general trend; as the enzyme concentration increases the time taken for the solution to clear decreases. This is most likely caused by an increase in the number of enzyme molecules as the concentration increases, meaning that there are more enzymes for the casein to be broken down by. And as the casein breaks down it becomes soluble and dissolves in the water forming a clear solution.
The graph does not, however, look particularly valid. Quite a few of the results, the most noticeable for the 0.05% concentration, have the raw results very different from the average, meaning that they are probably not reliable.
I think that the main reason that the results were so varied was because of different people were seeing how long it took to read some text through the solution and everyone’s opinions of when that is varies. There may also have been variation in the way we measured the solutions out. Moreover, because two of the readings have only one result rather than three results they were not as accurate or reliable as the rest. This is because, if you only have one result you cannot discount any anomalies or work out a more valid average. (This would be random error as the values did not differ from the averages by the same amount.)
An easy mistake to make in this experiment is that it is measuring the rate of reaction when it is in fact an experiment that measures the time taken for the solution to clear, then the rate of reaction can be calculated from the results. Because of this at first the results look inaccurate as the graph is time plotted against concentration, so it looks at first glance as though the results are the opposite to what I predicted. To work out the rate of reaction I would have to do the equation
Rate of reaction = 1/T
The graph of reaction rates against concentration shows a clear positive gradient, showing clearly that as the enzyme concentration increases so does the rate of reaction. This graph is clearer than the first graph as it does not have a deceptive gradient, so it would probably be more appropriate to use.
I believe that the equipment that we used was reliable enough for this experiment; the only real issue that I found was that we measured the results on different peoples opinions and eyesight. That meant that the results are not as valid as they might be had, say, a colorimeter been used. Unfortunately though our school does not have sufficient colorimeters for the amount of results we needed to achieve (24 results) in the time we had (1 hour).
There weren’t really many safety issues with this experiment, the only thing we really had to be careful of was getting enzyme on our skin or in our eyes as it may trigger allergies or irritate the skin. There weren’t really any measures taken to prevent getting the enzyme on our skin, other than safety specs(?) as the risk is so small, even if we did get any on our skin.
When we did the experiment we were careful not to drop anything, and we tried our best not to spill any enzyme or milk solution.
The method we used to do this was not necessarily the most precise as it was a whole class experiment, to fit it into the time we had, and everyone has slightly different views on when the solution was clear enough. Also for two of our results we only managed to do once for each because we ran out of milk solution. This means that these results are not necessarily reliable, as we could not tell if there was continuity in those results.
Conclusion :
I think that my hypothesis has had some evidence to support it from my experiment. (It isn’t proved as proof is absolute.) The method we used was not very accurate as it relied on different peoples opinions of when the reaction had occurred. It also was not organised particularly well so we ran out of milk solution and therefore could not get a full set of results. However it does give a general idea of what happens.