Method
The first thing I am going to do is set the water bath to 10°C. As room temperature is greater than this, I may have to use ice to bring the temperature down. I will then put 1cm3 of 1% concentration catalase (enzyme) in a boiling tube and put it in the water bath. After this, I will put 8cm3 of 6% concentration hydrogen peroxide (substrate) into a boiling tube and fit it with a bung that has a collecting tube running through it into a basin of water. Over the delivery tube, I will put an inverted measuring cylinder filled with water to measure the release of bubbles from the reaction.
On confirming that the contents of the boiling tube in the water bath had reached 10°C, I will put it in a syringe and add it the contents of the other boiling tube. As soon as the first bubbles are released into the collecting tube, I will start the stopclock. Every ten seconds I am going to record the volume of oxygen collected in the measuring cylinder. I will do this for five minutes or until 100cm3 of oxygen has been collected.
The reaction will occur as follows:
2H2O2 → 2H2O + O2
The method will be repeated at 20°C, 30°C, 40°C and 50°C. I will carry out the experiment a minimum of two times, as a range of results will give me a better idea of how the enzyme works. I will use the sets of results to get an average.
Variables, other than temperature, that may influence my results are enzyme concentration, substrate concentration and pH. These will be kept constant throughout the experiment. If they aren’t, it could alter the results in ways which they are not supposed to be.
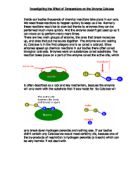
Hydrogen peroxide is a corrosive chemical and contact can irritate and/or burn the eyes. It can also cause damage to the skin. Wearing gloves and safety goggles can help avoid this.
Implementing
These are the results I received after carrying out the practical experiment:
I am going to carry out my graphs and my analysis using the average results.
Rate of reaction =
Analyzing evidence and drawing conclusions
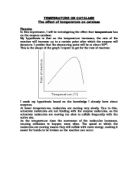
Graph 1 shows the volume of oxygen produced by a reaction between catalase and hydrogen peroxide at different temperatures
In this graph, you can see that as the temperature increases, oxygen production gets faster until it reaches 50°C, where it slows down.
As the lines get steeper (as the gradient increases), it means the oxygen is being produced faster.
At 10°C, it takes 5 minutes just to collect 64cm3 of oxygen from the reaction. The low temperature means that the enzyme is going to act slowly at this point.
At 20°C, it takes 4 minutes and 10 seconds to produce 100cm3 of oxygen from the reaction. Between 30 seconds and 180 seconds*, the line shows that oxygen production and time taken are directly proportionate.
At 30°C, it takes 3 minutes and 20 seconds to produce 100cm3 of oxygen from the reaction. At each of these segments of the line (10 seconds and 60 seconds, 60 seconds and 140 seconds, 140 seconds and 170 seconds, and between 170 seconds and 200 seconds*), the production of oxygen is directly proportionate to the time taken to produce it.
At 40°C, it takes 2 minutes and 40 seconds to produce 100cm3 of oxygen from the reaction. This is the temperature at which oxygen is produced the fastest (optimum). Between 20 seconds and 150 seconds*, the line shows that the production of oxygen is directly proportional to the time taken to produce it.
Then at 50°C, it takes 5 minutes to collect only 83cm3 of oxygen from the reaction. This shows that, somewhere between 40°C and 50°C, the enzyme began to denature.
Graph 2 shows the rate of the reaction as the temperature increases. As the temperature increases, the rate of reaction increases until it reaches 50°C, where it decreases rapidly. The cause of this is most likely to be that somewhere between 40°C and 50°C, the enzyme began to denature.
The optimum temperature on the graph is 40°C.
*= segments marked in red on graph
Evaluating evidence and procedures
To make the experiment more precise, I carried out the experiment twice so I could use the results to work out an average.
On doing this, on Graph 1, I noticed that the lines for 10°C and 50°C had slightly irregular shapes compared to the other lines.
A number of things could have caused this, such as:
Next time I do the experiment, I will carry out the method three times rather than twice. This will give me a better average to work from, making my results. I intend to make sure my apparatus has been sterilized and avoid sharing them, so as not to contaminate the contents. I will also use a wider range of temperatures, so as to find the exact temperature at which catalase denatures.
Also, whilst carrying out the experiment, I’m going to keep the test tube contain the enzyme in the water bath at all times because, before, I removed the test tube from the water bath. The enzyme being in the air may have caused the temperature to increase/decrease from the temperature it was supposed to be at, hence having a big effect on the final results.