Aim
My aim is to investigate how changing the temperature of the surroundings will affect amylase activity.
Hypothesis
I predict that amylase activity will increase up until 40ºC because most chemical reactions increase in rate. After this temperature I believe that the rate will decrease because the amylase will become damaged. From 60ºC onwards I think that the rate will have almost stopped and at 70ºC the enzyme will have become denatured.
Method
- Using an auto-pipette add 2cm³ of 0.5% starch solution into a labelled test tube.
- Again using the auto-pipette, add 2cm³ of 1% amylase solution into a labelled test tube.
- Place both of the tubes into the water-bath marked 40ºC for 5 minutes. This allows the solutions to reach the acquired temperature.
- Whilst the tubes are warming up, place 1 drop of iodine solution into each well of a dimple tile.
- After 5 minutes add the starch solution, to the amylase solution and place back into the water-bath. Start a stop-clock.
- Every 30 seconds remove 1 drop of the starch/amylase mixture and add to the iodine solution in the wells on the dimple tile.
- Take note of any apparent colour change.
- If the iodine has black/blue granules present, then repeat step 6 until no further granules can be seen.
- Note the final time that this happens.
- Repeat steps 1-9 for 0ºC, 30ºC 50ºC, 60ºC and 70ºC.
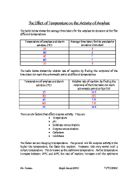
Results
Groups were selected to test certain temperatures and record their results. This enabled us to test each temperature a minimum of 5 times to give an average for a more accurate result.
Conclusion
At the beginning of the investigation I predicted that amylase activity would increase up until 40ºC because most chemical reactions increase in rate. After this temperature I believed that the rate would decrease because the amylase will become damaged. From 60ºC onwards I think that the rate will have almost stopped and at 70ºC the enzyme will have become denatured.
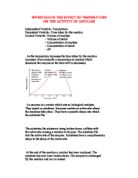
My results support most of my hypothesis; I see that I was correct in saying that amylase activity would increase. This is because as molecules heat up they gain more kinetic energy this makes them move around faster, which increases the chances of a collision. The fastest rate was at 40°C – which was what I predicted. The rate was fastest at this temperature because the temperature provided enough kinetic energy to supply the molecules with to make successful collisions, but not so high that the temperature broke the hydrogen and ionic bonds of the amylase – if this were to happen then the enzyme would have denatured. At 70ºC I am assuming that the amylase had denatured because after 10 minutes there failed to be a colour change. After analysing my results table and graph, I notice that the rate increases from 0ºC to 30ºC, then to 40°C. From then on the rate gradually decreases from 40ºC to 50ºC and then surprisingly the rate increases at 60°C. I think that the 60ºC rate is too high or 50°C is too low. On my graph you can see that 60ºC is higher than 50ºC but the optimum temperature for enzymes is 37ºC this is closer to 50ºC therefore this should be higher.
After 10 minutes of testing, by three groups, 70°C failed to indicate a colour change. Maybe if I had more time then I would have tested it further. As there was no apparent colour change I am assuming that the rate is for 70ºC is 0, I am making the assumption that a reaction was never going to happen at 70ºC. This is because if an enzyme is subjected to a higher temperature then it will denature. This means that the three-dimensional tertiary structure of the enzyme collapses because the high temperature breaks the electrovalent, disulphide and hydrogen bonds. The active site then changes shape so the substrate can no longer fit because the shape of the active site is not complementary. Products can no longer be formed consequently the amylase is useless.
Evaluation
After inspecting my graph and results table, I have identified three anomalous results, which are at 50ºC, 60ºC and 70ºC. Looking at my table in particular at 60ºC, I noticed that the rate here is too fast- compared to the rest of the temperatures. It is also much faster than the rate at 30°C, which seems strange because 30°C is much closer to the optimum than 60°C. However I also noticed that a rate of 5.4 for 50°C could be a bit low. At 60ºC the rate that group 2 took of 7.0 seems much higher than the rest – the rate here was too fast.
My graph shows 40ºC to be the temperature that gives the fastest rate. I think that 60ºC should be lower on the graph and 50ºC should be higher. This is because 37ºC is much closer to 50ºC. The graph would look better if 50ºC and 60ºC swapped positions.
I think the following things could have affected my results:
Students may not note a colour change correctly.
Too much amylase could have been added therefore making the rate too fast, which could have happened at 60ºC. It would be too fast because there would be more enzymes to react with the starch molecules.
Not enough amylase may have been added therefore the rate would be too slow, for example 50ºC. Not enough enzymes would be present to react with the starch.
Excessive amounts of starch could have been used making the rate too slow because there are not enough enzymes for the starch.
Too little starch would make the rate happen too quickly because there is less starch for the enzymes to work with.
Results could have been affected by incorrect temperature of the water-baths.
People could have misread the stop-clock.
We may not have left the test tubes in the water-baths for a long enough to reach the desired temperature.
Limitations
We could have used a spectrophotometer to measure absorbency rather than relying on our own vision to note colour change. Our water-baths could have been set up incorrectly or they could be faulty. The temperatures, which we experimented with, were not chosen by us. Time was a restriction because it was not possible for every single group do perform every temperature. More repetitions would result in a better mean value.