To make this a safe test I will have to keep all wires and equipment neat. I will have to make sure that the desk is tidy. Between writing results I will have to switch the power pack off at the plug. I will have to make sure that I keep hair tied back, and make sure I don’t touch the wire
In the experiment I am going to measure the current, voltage and resistance, and the length of the wire,
In the experiment I am going to change the distance between the crocodile clips on the wire.
Apparatus-
- Copper wire
- Crocodile clips
- Power pack
- Wood
- Voltage
- Ammeter
- Metre rule
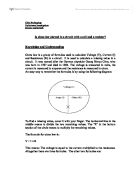
Diagram of apparatus
Step by step plan
Step 1- set all the equipment up safely and neatly.
Step 2- Measure out a metre using the metre rule and place the crocodile clips at 0cm and 100cm.
Step 3- Switch the power pack on and record the voltage and current
Step 4- Turn the power pack off and move the crocodile clip to 90cm
Step 5- Turn the power pack back on and record the Voltage and Current for 90cm
Step 6- Repeat this for 80cm, 70cm, 60cm, 50cm and 40cm.
Step 7- Repeat this process four more times to make the test fair
Step 8- Turn off the power pack and put equipment back neatly.
Results
Average Results
Evaluation
I think that my experiment was very successful, as I don’t have any results that are very far off the point. I made no mistakes during my experiment and my wire didn’t burn out. I think that my test was very fair, however I could have made it fairer by leaving the power pack on for the same amount of time before reading the results. I could have made it safer by waiting slightly longer before moving the crocodile clips, but despite doing it quickly I didn’t get burned. I think that my results are accurate and are fair enough for me to test ohm’s law.
Conclusion
I found that my prediction that the greater the distance between the crocodile clips was, the more resistance there was, was proved right as looking at the results I can clearly see that the greater the distance between the crocodile clips, the higher the resistance. I can also see from my results that when there is a low current, the resistance is high. There is no clear relationship between the voltage and the resistance.
Graph of results
Discussion of results
On the length/resistance graph I can see that the higher the length, the more potential difference there is in the circuit. The points of the graph are plotted in a straight line, and there looks to be roughly the same amount space between each point.
On the length/ current graph I can see that the longer the length, the smaller the current becomes. The points are plotted roughly the same amount of distance away from each other, and have a slight curve to the line.
On the length/voltage graph I can see that the points are very close together and do not have a lot of variation. The longer the length, the higher the voltage becomes, however the voltage does not increase by a lot.