An oscillating system once started and left to oscillate keeps constant time. The frequency of its oscillation is called the natural frequency. If, now, a small force is applied at the end of each swing, any energy is converted during the oscillations is replaced and added to. This causes large amplitude oscillations to build up. A typical example is a child on a swing. A small push at the end of each swing builds up large amplitude.
So in the experiment I predict that the bigger the angle at which the pendulum is released the more oscillations will take place. The smaller the angle the less oscillations will take place. I predict this will happen because the bigger the angle the more gravitational potential energy there is, when released there is going to be more kinetic energy thus there will be more oscillations. When the angle is smaller there is less gravitational potential energy thus when released there is less energy to change into kinetic therefore there will be less oscillations.
I also predict that the shorter the length the more oscillations will take place. Therefore the longer the length less oscillations will take place. This will happen because the shorter the length the less distance the pendulum has to oscillate thus there will be more oscillations. With a longer length the pendulum has to move a further distance, which decreases the amount of oscillations.
In a pendulum all the mass is at a point some distance away from the point of support.
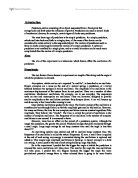
Here is a graph of what I predict will happen to the number of oscillations taking place to the size of the angle at which the pendulum was released:
Method:
Apparatus:
Clamp,
Stand,
String,
Bob (The small ball hanging from the string)
Rubber Bung (With a whole in the middle)
Glass Rod,
Weighing Balance,
Protractor,
Blue-Tack,
Stopwatch.
Procedure:
I first set up the equipment. I got a clamp and a stand and fixed them together at the end of the bench. Between the clamp I placed the rubber bung. I the picked out a bob and weighed it on the weighing balance. I then cut a long piece of string. I then threaded the string through the bung with a whole and tied the bob to the end of the string, which was facing down to the floor. I then placed the glass rod through the whole in the bung to make sure that the string would fall. I then got my meter ruler and measured the correct length for the string. I then fixed onto the rubber a protractor using blue-tack. I then had to align the protractor with the string when it is absolutely still. I then would lift the bob to a certain angle; I would look bob from a side angle to make sure it was parallel to the bench so that when I released it, it would not hit the bench. I then released the bob; upon my release I would start the stopwatch and record how long it would take for the pendulum to oscillate twenty times. I repeated this experiment several times: every time wanted to change the length of the string or change the angle of the string.
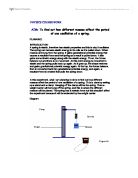
Diagram of Experiment:
Results:
Conclusion:
Graph 1: The graph that shows the relationship between the average time taken for 20 oscillations and the angle at which the pendulum was released; the length of the string was 10cm. The graph tells us that the bigger the angle the longer it takes for 20 oscillations. This shows that the average time taken for 20 oscillations is directly proportional to the angle at which the pendulum was released. You can tell this because as the time gets longer and the angle of release gets bigger the line is going up in a diagonal fashion. There is a positive correlation.
Graph 2: The graph that shows the relationship between the average time taken for 20 oscillations and the angle at which the pendulum was released; the length of the string was 20cm. The graph also tells us that the bigger the angle the longer it takes for 20 oscillations to take place. This graph also tells us that the average time taken for 20 oscillations is directly proportional to the angle at which the pendulum was released. You can tell this because as the time gets longer and the angle of release gets bigger the line is going up in a diagonal fashion. There is a positive correlation.
Graph 3: The graph that shows the relationship between the average time taken for 20 oscillations and the angle at which the pendulum was released; the length of the string was 50cm. The graph also tells us that the bigger the angle the longer it takes for 20 oscillations to take place. This graph also tells us that the average time taken for 20 oscillations is directly proportional to the angle at which the pendulum was released. You can tell this because as the time gets longer and the angle of release gets bigger the line is going up in a diagonal fashion. There is a positive correlation. However, I feel that there is a source of error in the experiment using 50cm string because the graph begins to slant down.
Graph 4: The graph that shows the relationship between the average time taken for 20 oscillations and the angle at which the pendulum was released; the length of the string was 100cm. The graph also tells us that the bigger the angle the longer it takes for 20 oscillations to take place. This graph also tells us that the average time taken for 20 oscillations is directly proportional to the angle at which the pendulum was released. You can tell this because as the time gets longer and the angle of release gets bigger the line is going up in a diagonal fashion. There is a positive correlation.
I have come to the conclusion that the average time taken for 20 oscillations is directly proportional to the angle at which the pendulum was released. If I had drawn a graph showing the average time taken for a 1 Oscillation over two trials against angle would obviously bring the same conclusion as that average time taken for a 1 Oscillation over two trials is directly proportional to angle of release.
Evaluation:
The experiments were very important to the investigation as I would be getting my results from them and because they were carried out with the most possible degree of care and accuracy. However, sources of error were inevitable. The following are precautions taken whist doing the experiments to decrease the level on inaccuracy: -
The metal bob hanging from the pendulum was weighed several times to make sure the mass of the pendulum was accurate. This was done so that if the experiment was broken up and then the experiment could be needed again it then I would know which was my pendulum.
The length of the string was measured accurately several times to make sure it was the correct length as if there were slight alterations then the experiment could develop wrong results.
The following sources of errors, in my opinion, have affected my results, they are: -
I feel that lining the string with the 90º on the protractor a challenge because the string would always be moving. Also aligning the string was difficult because to focus on the string and the 90º because they are both to thin lines and it was difficult to determine if the string was actually on the 90º mark.
Also to get the clamp aligned with the bench was difficult because the bench was at an angle. I needed to make sure the clamp was the string was parallel to the bench so that when the pendulum would swing it would not hit the bench.
I could have improved the experiment by timing how long it would take for 30 or 40 oscillations to take place so that it would show the exact timings of the oscillation.
In general I am happy with the outcome of this experiment.
Bibliography:
Encyclopedia,
Teachers Notes,
Own Knowledge,
Physics Matters by Nick England,
GCSE/Key Stage 4 Physics by Keith Palfreyman and Colin Maunder,
Examining GCSE Integrated Science by Barry Stone, David Andrews, and Roy Williams.
By Hussain Jawad