Safety Precautions
Bags stools and other possible obstructions were removed from gangway. Worktops were cleaned and dried to reduce risk of electrocution and prevent damage or interference to experimental equipment. Standard lab safety was enforced. In order to keep errors to minimum and to ensure fair test, equipment such as wires, voltmeters, ammeters, resistors, PSU’s and filament lamps remained the same throughout the experiment.
Method
The work surface was ensured to be dry and clean beforehand. Bags, stools and other possible obstacles were removed from the work area. The equipment was collected according to the list given and was checked to be clean, non-corroded and undamaged. The equipment was connected as is shown in figure 4. It was not turned on until connections were checked to be correct and safe and settings on the power supply and meters were at their lowest. Writing equipment was in place before the experiment was started.
The equipment was then turned on. As the voltage on the PSU was increased it was confirmed on the voltmeter and the reading on the ammeter was noted. For the first circuit a total of 7 ammeter readings were taken and repeated. Each time the voltage was increased by 2 V.
The value for each voltage was recorded in the table. Once the highest voltage had been reached for the PSU the circuit was switched off and the fixed resistor was replaced with a filament lamp (figure 6). The voltage readings were then repeated as before and were inserted in another table. After this the equipment was cleared away. The tables were then plotted onto graphs.
Method in summary:
- Apply safety precautions.
- Gather equipment and connect it according to figure 4.
- Recheck for safety and turn the circuit on.
- Increase the Voltage by 2V every reading and note the current reading on the ammeter.
- Once 12V is reached switch the PSU off.
- Replace resistor with a Filament Lamp
- Carry out steps 3-5 again.
- Once readings for filament lamp and fixed resistor are tabulated clear up equipment.
- Plot an I-V graph for the fixed resistor and Filament Lamp.
Variables
The controlled variables in this experiment are the resistors and equipment used.
The input variable in this experiment is the voltage.
The output variables of this experiment are the current and resistance.
Tables of results
Analysis of Results
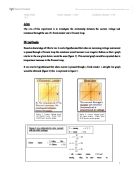
Both graphs produced results that should be expected by the types of resistor used. The graph for the fixed resistor is a straight line through the origin. The slope of the line was unchanged i.e. no tapering off. This is what should be observed when fixed resistors are used. The current value for 4.1V is more than was expected; it may be classed as an anomaly but does not affect the line of best fit too much. The reason for this value may be down to poorly calibrated equipment or incorrect reading from the ammeter i.e. human error. The remainder of the current readings fit the expected trend. The hypotheses for the fixed resistor which was:
- When current is passed through a fixed resistor a straight line graph would be obtained
On the graph for the filament lamp the curve of best fit suggests that resistance increases as voltage and current are increased. This is shown by the resistance values from the three gradients taken from the indicated tangents (Table 4). The gradient calculated at each of the three points was different and the resistance value was also increased. This occurs due to an increase in temperature of the filament lamp. This also confirms my hypotheses as being correct.
- When current is passed through a filament lamp the resistance would increase in an irregular fashion.
- So that a curved graph would be produced due to temperature increases.
Results for both resistors were as expected based on scientific knowledge of Ohm’s law and how resistance is affected by V, I and temperature. All parts of the hypotheses were confirmed to be correct and supported by the results that were obtained.
Conclusion
Looking at the graphs and the table of results it is clear that what I hypothesised at the beginning of the experiment was correct correct:
- When current is passed through a fixed resistor a straight line graph would be obtained
- When current is passed through a filament lamp the resistance would increase and a curved graph would be produced.
The curve and straight line graphs prove that there is a relationship between the resistance, current and voltage. When V increases I increases too, as long as resistance stays constant (for fixed resistor) or increases (for filament lamp). Also as the temperature increases the resistance increases, as is observed with the filament lamp.
Evaluation
The experiment was successful in its aims. The experiment was also successful since there were few anomalies, only one for the fixed resistor. Thus it can be assumed that our results were accurate given the sensitivity of our equipment. We tried to resolve these anomalies by doing these tests again, however this resulted in getting the same figure. We can assume that the equipment is not to blame since it was kept the same throughout the experiment. The experiment was conducted in a safe environment and all precautions taken before the experiment paid off as no accidents took place.
To conduct a fair test it would have been practical to use averages for a series of current readings. This could be done by using two different sets of equipment, conducting the experiment on each set and averaging the values. This could help us reduce the margin of error in any anomalies found. It may have been interesting to investigate the same aim with a wider range and more sensitive set of equipment. Smaller increases of voltage on the PSU would have allowed us to plot the graphs with more accuracy. If possible it would have been interesting to use a diode. We may also have adjusted variables such as the thickness, length and type of wire used to investigate the effect these factors have on Ohm’s law and our graphs. we would also investigate how changing the circuit diagram would have affected our results.
However it would not have been possible because of time limitations
Bibliography
GCSE double Science Physics – CGP – ISBN: 1-84146-401-5
New Modular Science for GCSE, (Vol 1), - Heinemann (1996) – ISBN: 0-43557-196-6
AQA GCSE Science syllabus (2001).
A level Physics Letts Study Guide (reprinted 1996)