Apparatus
Plastic Container
10cm3 and 100cm3 measuring cylinder
Stopwatch
Calculator
Range of 2H2O2 concentrations (beginning at 2vols and ending at 10vols)
250cm3 conical flask + bung + delivery tube
0.5g batches of dried yeast
Thermometer
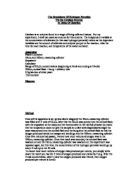
Diagram
Method
Once all the apparatus is set up (see above diagram) the 10cm3 measuring cylinder was filled with 2 vols of 2H2O2, after that the 2H2O2 was poured into the conical flask, with the stopwatch at the ready and the thermometer in the tub full of water (to check that the temperature does not give the sample an unfair advantage/disadvantage) the yeast was poured into the conical flask and the bung shut the conical flask so that the oxygen produced would not escape and would go into the 100cm3 measuring cylinder. Once five minutes had passed, I wrote how much volume of oxygen was in the 100cm3 measuring cylinder. Once that result was recorded, the conical flask was washed out and the 10cm3 measuring cylinder was washed out, the experiment was repeated again, but this time, the concentration of the hydrogen peroxide would go up every 2 vols up to the 10 vols.
To record how much volume of oxygen was produced per minute, you simply write down the result you had for 5 mins of oxygen produced and divide by 5 (e.g. if for the 2 vols concentration, after 5 mins the oxygen produced was 15cm3, then oxygen produced per minute is 3cm3)
Results
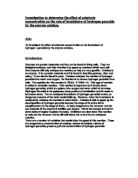
The results table and graph was based on the class average
The reason why 0 was included was to give the graph a starting point (i.e. from 0 to 4.113333)
There was a steady increase from 0 to 8 vols, then from 8 to 10 vols, the concentration gradient shot up, this could be because there was more substrate concentration for the enzyme to react with.
Sources of error
☹ Not all the yeast is the same, so therefore there would be different amount/concentration of catalase.
☹ PH temperature, if that was controlled more, then the experiment would have had better results.