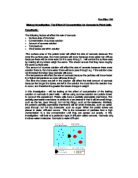
When water passes into the cell from the outer solution the cell swells. It will then be turgid. When the opposite happens and water is passed out, causing the cell to shrink, the cell is plasmolysed. This can also be called flaccid.
When the tuber is placed in the 0 Molar solution (pure water) I think the tuber will become turgid. This is because the solution inside the tuber will be stronger than the solution outside the tuber. In order for the internal solution of the tuber to be equal with the external solution, the water from outside the tuber has to diffuse inwards through the partially permeable membrane to dilute the inner solution. The tuber’s gain of water will cause it to expand, and therefore become turgid.
When the tuber is placed in the 1 Molar sucrose solution I think the cells will become plasmolysed. This is because the solution outside the tuber will be stronger than the solution inside the tuber. In order for osmosis to occur and the solutions to be of equal strengths, the water from inside the tuber will mainly diffuse outwards through the partially permeable membrane to dilute the outer solution. The tuber’s loss of water will cause it to shrink, or plasmolyse.
The greater the concentration of water in the external solution the greater the amount of water that enters the cell by osmosis. The smaller the concentration of water in the external solution the greater the amount of water that leaves the cell. Therefore I predict that the lower the concentration of sucrose of the external solution, the more the potato tuber will become turgid, and the higher the concentration of sucrose in the external solution, the more the potato tuber will become plasmolysed. As the concentration increases from 0 M to 1 M I expect the tubers size and weight to increase.
Method:
In this investigation I am looking into the effect of osmosis on potato tubers when they are placed in different strength sucrose solutions. It is easier to ensure a fair test when only using one variable. So all the other variables will be kept as constant as possible to ensure the test is fair. I will keep the size of the tubers constant by weighing each tuber before I use it in the investigation. I will also measure the amount of sucrose solution before using it in the investigation. I can also measure the length of time the tubers are left in the solution. I will conduct all the experiments at room temperature, which may change slightly, but should stay approximately the same, or only change by a few degrees, which would not have a big effect on the investigation. We will move the tubers around using tweezers to make sure they are not contaminated with sugar solution this, again, will ensure a fair test.
- I will measure the tubers and, using the scalpel on the tiles, I will cut them down to the same weight as my lightest tuber. This will ensure they will all be the same size. I found out in a preliminary experiment, that my smallest tuber was 8.85g, so this is how much I will make all my tubers weigh. I will lift the tubers on and off the scale using the tweezers to make sure they are not contaminated
- I will label my test tubes A, B, C etc so I can recognise them.
- I will mix up my solutions before starting to put the tubers in, so I can put them all in at the same time. This will ensure they are all left in for the same amount of time. I will create my solutions by diluting the 1 Molar solution with the appropriate amount of distilled water. For example, when creating a 0.5 Molar solution we would mix 10ml of distilled water with 10ml of 1 Molar sucrose solution.
- I will then place my tubers in 20ml of sucrose solution, ranging from 0M (pure water) to 1M (0, 0.2, 0.3, 0.4, 0.5, 0.6, 0.8 and 1M) and leave them for 20 minutes. This is enough time for osmosis to occur. I will again move the tubers around using tweezers.
- After 20 minutes I will remove the tubers from their solutions. I will remove any excess solution from them with blotting paper before re-weighing them and recording my results. I know that 20 minutes is long enough, because I found this out in my preliminary experiment. (the results of which I used in my final results table).
- I will carry out each test 3 times and take an average result, this will help make my results more accurate and also help me to spot any results that do not fit.
Safety:
Throughout the practical work in this investigation I will wear goggles. This will ensure that no bacteria could splash into my eyes, which would provide a good breeding area for bacteria, possibly causing an infection. I must also be careful not cut myself when cutting the tubers down to the right weight, as the cut could easily be infected if I were to get sucrose solution in it.
Apparatus:
- Scalpel
- Blotting paper
- Boling tubes
- Test tube rack
- Tweezers
- Scales
- Tile
- Syringe
- Potato tubers
- Sucrose solution
- Water
- Test tube rack
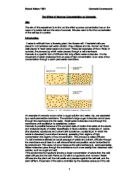
Diagram:
Results:
The result in red appears to be anomalous; I have therefore left it out of my average difference.
Graph:
Graph Analysis:
My graph does not fit a line of best fit very well, but looks as though it needs two lines of best fit. This could have been caused because I did my practical experiment over two lessons. In the different sessions I used different potato, solution and the air temperature could have been different. All this could have caused my graph to come out as it did.
Analysis:
The results show that, in accordance with our hypothesis, the cylinders will expand when external solute concentration is low (high water concentration), and contract in strong solutions (low water concentration). This is due to osmosis, where water passes from weak solutions to strong solutions across a semi-permeable membrane, such as a cell membrane. Because the results were as I expected them to be, I think they are fairly reliable (excluding the anomalous result).
My line best fit does not pass through the origin, this suggests that the percentage of gain or loss of weight in the potato tuber is not directly proportional to the solution strength, though there is a pattern because the more the solution strength increases; the more the tubers mass decreases
My graph did not come out as I expected it to, but appeared to need two lines of best fit. This could have been caused by the reasons stated in my graph analysis. (Different potato, solution and the air temperature could have been different)
Evaluation:
In my opinion the experiment went well. I gained a good set of results and altogether I am pleased with the investigation. The results reflected my hypothesis; this suggests that the experiment was fairly accurate. Although 3 repetitions of each concentration are sufficient, there was a possible anomalous result (red on results table, and left of graph). This part of the investigation would
Need to be repeated.
The anomalous result could have occurred for many reasons. The tuber could have become contaminated with the sugar solution or, although the cylinders were taken from the same potato there is no guaranteeing that the concentration of the cell sap remains the same throughout the potato. I also could have put the tuber in the wrong solution or left it for too long in the solution. It could also have been caused by my mixing the solution to the wrong strengths or inaccurately measuring the tuber. E.g. I could have forgotten to put the scales back to zero after changing to blotting paper.
I would have liked to take all my results in one session, which would have enabled me to use the same potato, solution, and be surer the air temperature was not changing. This might have insured that I didn’t get the two sets of results that looked so different that I did.
I would have liked to re-take the part of the experiment in which I got the anomalous result, but in the time given, this was not possible. I would also have liked to have redone all my experiments, leaving the tubers in the solution for 30 minutes, rather than 20 and takes 4 results each time. I feel this would have given me better results, as the tubers would have had more time to diffuse, and possibly allow me to find out the saturation point of the chips, and I would have better averages with the higher number of results. Again, it was not possible to do this because of time restrictions.
The cutting of the potatoes was the most difficult part of the experiment as although I was recording my results by mass, it could well have affected the surface area and so the overall rate of osmosis. I was also unable to record the length of my tubers at the thickness varied, and they were not perfect tubes, but had edges missing. If I were to repeat the experiment I would have liked to find a more accurate way of cutting the tubers, possibly using a machine. I would also have liked to find a more accurate way of creating the different strengths of sucrose solution because bubbles in the syringes could have changed the strength of my solutions. The syringes used often had air bubbles and this could have affected the solution strength and therefore my results.