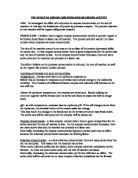
Many enzymes change shape when substrates bind. This is termed "induced fit", meaning that the precise direction of the enzyme required for catalytic activity can be induced by the binding of the substrate.
Induced fit is one of the two main models of enzyme action. In the Induced fit model, the active site is still thought of as having a very distinctive shape and arrangement, but a rather more flexible one. Once the substrate enters the active site the shape of that site is modified around it to form the active complex. Once the products have left the complex the enzyme goes to it inactive, relaxed form until another substrate molecule binds. See the diagram.
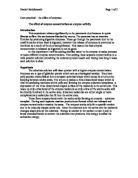
The other model is the Lock and Key Mechanism. The lock and Key mechanism fits most of our evidence about enzyme characteristics. We can see how enzymes can be saturated when the concentration of substrate molecules rises above a certain level, all the active sites become bound in enzyme/substrate complexes. It was called the key lock mechanism, because the substrate fits into the active site as a key fits into a lock. See Below Diagram.
The basic enzymatic reaction can be represented as follows:
S + E P + E
Where E represents the enzyme catalyzing the reaction, S the substrate, substances being changed and P the product of the reaction.
Enzymes act as catalysts and lower the activation energy for reactions. The lower the activation energy for a reaction, the faster the rate. Thus enzymes speed up reactions by lowering activation energy.
There is an energy barrier that separates the energy levels of the reactants and products. Energy must be added to the reactants to overcome the energy barrier, which is recovered when products are formed. The energy barrier is known as Ea, the activation energy. The activation energy is distinct from the DG, or free energy difference between the reactants and products.
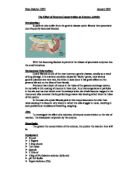
Apparatus
- Alkali Trypsin Solution
- Milk powder
- Test Tubes
- Stop Clock
- Thermometer
- 20ml, 10ml, 5ml syringes
- 100ml Beaker
- Distilled water
- 250ml beaker
Method
First I will collect the equipment. As the trypsin solution that has been provided is already at 1%, I will not be able to concentrate the solution any higher, and for this reason I have decided to lower the concentration of enzyme to my desired levels.
To achieve this I will have to have, depending on the concentration a ratio of distilled water and trypsin. I want to make 220ml of each concentration, e.g. to make a 0.5% concentration I will need 10mlof distilled water and 110ml of trypsin solution.
The concentrations and volumes needed for the concentrations are stated in the below table.
Using 5ml, 10ml, 20ml syringes I will make these concentrations. When the concentrations are made, I will take at test tube and add 5ml of milk, to this I will add 5ml of trypsin solution and place it into a water bath. I will time it to see how long it takes the trypsin to break down the casein protein in the milk. Colour changes from white to clear wills indicate the end point of experiment. I will use this method for each concentration and repeat each experiment 3 times to achieve accurate results so an average can be achieved.
Results Table
These are results from my experiment.
Conclusion
From my results I conclude that as the enzyme concentration increases the time taken for the breakdown of protein by trypsin solution is decreasing. This proves that my prediction was correct, and is shown in my graph, e.g. concentration 0.8% has an average time of 136 secs compared to 0.2%, which has a average time of 266 secs. This is due to more substrate molecules present and this helps enzymes active site bind with more new given substrates in a given time. This shows that a enzyme works by forming a short lived enzyme substrate complex.
When you observe the results table you notice that a couple of the results gained are anomalous, but my results are reasonably accurate giving that simple apparatus was being used. The errors could have been due to inaccurate measurements and a change in temperature.
Evaluation
Overall I believe that my experiment was fairly accurate, but when you observe the results table you notice that a couple of the results gained are anomalous as shown in the results table experiment 1, concentration 0.4/ 443 seconds. This could be due to the inaccuracy of the equipment used. Another possible reason for this could be that the equipment could have been dirty. Human error could have played a part as the readings could have been taken at the wrong time, e.g. recording and taken readings at same time.
Also the temperature could have altered during the process of the experiment. This could have caused the enzymes to inactivate, as they would have been below the optimum temperature and this could have had caused them to stop functioning and increase the rate of the reaction. Also the pH of the enzyme could have had changed during the reaction and this could have caused the ionic bonds that hold the structure of enzyme together to split. This would affect the charges on the amino acids within the active site and the enzyme will not be able to form an enzyme substrate complex. Trypsin works best at a pH of 8 and if this alters it will cause the ionic bonds of trypsin enzyme to split, and lead to a change in the reaction.
To improve the experiment I could use more accurate equipment and take more readings to see if the errors are a one off situation. It also would help the validity of results if I varied the substrate concentration to see the maximum activity. Also I could record by using the data logger or the colorimeter, which is a more reliable and accurate way of recording colour-changing results. Also I could use magnetic stirs and automated pipettes and burettes instead of the syringes and this would have also helped improve the validity of the results. Overall I am happy with the way I have gone about the experiment with the given equipment.