Apparatus –
10ml pipette
Pipette filler
5 x 25 ml measuring cylinders
2 x 10 ml measuring cylinders
1 x 100 ml measuring cylinder
Deionised water / wash bottle
Weigh boat
Spatula
5 x side armed test tubes
Delivery tubes and bungs
Balance scale
5 x 100 ml beakers
Bowl of water
Yeasts - brewers and bakers (at least 20g of each)
- M glucose solution (at least 1 litre)
Water bath
Thermometer
Glass rod
Stop clock
The following are the different molar percentage concentrations of the glucose solution I will be adding to the yeasts:
(%)
0 (100% pure deionised water) 0% glucose
5
10
15
20
25
30
35
40
45
50 (50:50 - water: glucose) 50% glucose
55
60
65
70
75
85
90
95
100 (100% 1.0 M glucose) 100% glucose
The above apparatus and concentrations were worked out by doing some control tests: one consisted of having no solution with the yeast, one just contained 100% glucose, one contained 100% water and finally, one contained a mixture of 50:50 glucose and water.
Instructions of how to make the different concentrations of glucose solution will be shown in the method.
Variables –
Dependent: CO2 production measured in cm3
Independent: (Manipulated) glucose molar concentrations
(Controlled) temperature to be set at 30o using a water bath. An increase in temperature would mean an increase in the activity of the yeast due to kinetic theory. Fluctuations in the temperature would affect the outcome.
Yeast amount to be measured at 0.5 grams using a balance. The yeast should be kept at a constant weight, as variations would lead to variations in the CO2 production. This would affect the results, as it would be assumed to be variations in activity and not the number of yeasts present.
Volume of solution to be 10ml as this fits in the test tube. Apparatus sizes are mentioned in the apparatus list.
The time allowed for each test tube for the reaction to take place is 20 minutes. If the time allowed was uncontrolled, I could not effectively measure the yeast activity.
As the majority of the carbon dioxide produced sticks to the yeast in bubbles, a fair agitation should be introduced. This will also increase the surface area of the yeast by exposing more yeast under the surface of the water. This can be achieved by gently shaking each test tube for five seconds, every five minutes. Yeast, time and temperature are the three key variables.
(Uncontrolled) the air displaced by the movement of the bung was equal with every test tube so this can be standardized and ignored. The temperature of the surroundings for example the glucose solution may have an unfair advantage, therefore, to minimize these effects, everything can be stood in the water bath to maintain a constant temperature of 30o, including glucose solutions and deionised water. The long-term storage of glucose may be to refrigerate it.
The contamination of apparatus may affect the results obtained. Regular cleaning will minimize these effects.
Replications – I will be using two different types of yeast, baker’s yeast and brewer’s yeast. I will also be using 21 different concentrations of glucose solution, starting with 0% glucose (pure water) and ending with 100% glucose, increasing each time by 5%. This is to ensure I obtain a wide enough range of results. To save myself time, I will carry out five of the experiments at a time (this is practicable).
This should also ensure the elimination of freak results until figures are consistent but is also due to the fact of the time limit given.
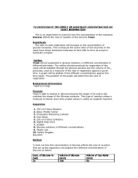
Method –
- Put on a lab coat and safety goggles and collect the apparatus required.
- Prepare the apparatus as shown below:
The displacement apparatus
-
Switch on the water bath and set to 30o c.
-
Stand glucose, yeast and all equipment into 30o c water bath for 5 minutes before the experiment to allow to acclimatise.
- i) Firstly, the different glucose solutions need to be made up. Using the 1.0M glucose solution, transfer with a pipette into a measuring cylinder, 5ml of the glucose. Transfer this to a 100ml measuring cylinder and dilute with deionised water to 100ml of solution. This has given the 5% solution (5% glucose).
ii) Stir thoroughly with a glass rod.
- 0% solutions should be 100% pure deionised water. 100% solutions should be 100% 1.00M glucose.
As it is a 100ml measuring cylinder, translations into a percentage are fairly simple. For example, a 55% solution would need 55ml of the 1.00M glucose solution diluted to 100ml with deionised water, so this would mean adding 55ml glucose : 45ml water, for the 55% solution.
NB: the above is the easiest method, though if this becomes a wasteful technique, a simple sum can be used to reduce the volumes of liquids used. For example, rather than using a 100ml measuring cylinder, use a 50ml measuring cylinder, therefore, halving the volumes of deionised water and glucose solution required. The 55% solutions would now need 27.5ml of the 1.0M glucose solution diluted up to 50ml with deionised water (22.5ml) and this would still be a 55% glucose solution.
- Transfer the 100ml of the measuring cylinder to a 100ml beaker and label it appropriately.
- Place it in the water bath.
-
Repeat the above procedure, increasing the amount of glucose each time accordingly (usually 5ml).
Do this until all 21 concentrations have been made up. (0% 100%)
Stand all labeled beakers in the water bath at 30o c.
- Firstly, using the bakers yeast, weigh out 5 separate lots of 0.5g into weigh boats. Transfer each of the weigh boats contents into each of the 5 side armed test tubes, ensuring not to disturb the displacement measuring cylinders.
- When each test tube contains 0.5g of yeast, using either a 10ml measuring cylinder or a pipette, add 10ml of the following glucose solutions: 0%, 5%, 10%, 15%, 20% and immediately replace the bungs and start the 20 minute timer.
-
Agitation – shake each test tube for 5 seconds, every 5 minutes.
-
When the 20 minutes are finished, record the volume of CO2 gas collected in the results table.
- Clean out all test tubes thoroughly and refill the displacement measuring cylinders with water.
-
Repeat the procedure from step 9 13, though this time use 25%, 30%, 35%, 40% and 45% glucose solutions. Still use 0.5g of bakers yeast until each of the 21 molar solutions has been tested.
-
When all 21 solutions have been tested with bakers yeast, repeat steps 9 14 again, this time using brewers yeast. (Again, do 5 at a time starting at 0% solution.)
- Record all results in the table.
-
Clean all equipment thoroughly, switch off water bath. Throw away any unused chemicals by washing down the sink with plenty of water.
Collection of Results –
Presentation of Results –
Ideally, this is how my graph should look.
It has a positive correlation in a sigmoid shaped ‘s’ curve.
The steepest part of the graph is the optimum concentration of glucose that the yeast can withstand.
I would expect that at the base of the curve, it would be fairly flat where the glucose concentration is too low for the yeast. Again at the end of the curve, I would expect it to be flat because the glucose concentration is now too high for the yeast to withstand. Both yeasts should produce the same shape curve though at a different level.
See graph paper
Conclusion – by looking at the graphs, the null hypothesis can be rejected and the alternative hypothesis can be accepted.
Yeast metabolises glucose for energy. An increase in the concentration of glucose means that the yeast has a more readily available source, therefore, metabolism increases resulting in a higher production of carbon dioxide.
There is a plateau on the graph because the yeast can only produce so many transporters for glucose. The plateau arises as the space for transporters reduces and all the channels are filled. This is one limiting factor. It may also be due to the yeast needing something else, other than glucose e.g. Nitrogen or Phosphorous if they are not in excess.
The above graph just shows that glucose concentration does have an effect on CO2 production and the rate of activity of any yeast.
Furthermore, I wanted to find out if glucose concentration had a different effect on different yeasts:
Analysis of Results – For the analysis of the results, I have decided to use the t-test. This is used when we make a range of measurements rather than counting numbers. The t-test compares both the mean and the standard deviation of two populations whose distribution curves overlap. The chi-squared test could also have been used
Null Hypothesis (HO) – Different species of yeast are affected in the same way, when varying glucose concentration.
Alternative Hypothesis (H1) – Different species of yeast are affected in different ways, when varying glucose concentration.
Using the earlier results -
Unpaired t test results:
P value and statistical significance:
The two-tailed P value equals 0.1123.
Therefore, by conventional criteria, this difference is considered to be not statistically significant.
Confidence interval:
The mean of baker's minus brewer's equals 3.224
95% confidence interval of this difference: From -0.789 to 7.236
Intermediate values used in calculations:
t = 1.6239
df = 40
standard error of difference = 1.985
As the difference between the two sets of data is not statistically significant (>0.05), the alternative hypothesis (H1) can be rejected and the null hypothesis (HO) can be accepted.
Therefore, Baker’s yeast and Brewer’s yeast have no different rates of activity, when exposed to different concentrations of glucose.
Evaluation – During the experiment, I encountered several problems with experimental design.
Firstly, concentrations of glucose cannot be kept constant throughout the experiment as the yeast immediately metabolise it. This may have an effect on the results. The effect could be corrected by constantly adding more glucose to the solutions in relation to the volume of CO2 released.
Secondly, for lower concentrations of glucose, 20 minutes may be too long a time period as the yeast may have consumed all of the glucose within that 20 minutes. Preliminary experiments should be done to show this is not the case.
Furthermore, as mentioned earlier, as the bungs were placed back into the test tubes, a small amount of air was displaced which could have also affected the results.
Also, the addition of oxygen may have improved the results obtained as well. Yeast prefer to work aerobically, therefore, different results may have been obtained if oxygen was passed through the solution and subtracted from the final volume of gas collected. Obviously, the available apparatus was a problem here. When yeast respires anaerobically, they may produce different volumes of CO2 – a lower yield to when they respire aerobically.
Although the water baths did keep the temperature steady within a few degrees Celsius, which was easier than using a Bunsen burner, they could never really keep the temperature constant which would have produced a much fairer test.
One big improvement that could have been made to the experiment would have been to replicate each test, on each concentration of the glucose 3 times. If the mean result of these three tests were taken, it would have produced much more accurate results. Obviously the time it would have taken to do this would have made it virtually impossible to carry out.
Finally, another problem, which may have accounted for anomalous results, is the idea that the mass of the yeast used each time (0.5g), may not have actually reflected the size of the population as some of the 0.5g of yeast may have in fact been dead to start with, making each test unfair.
Anomalous results – These are highlighted on the graphs. All of the above factors may have accounted for the production of these freak results. Unless several repetitions were carried out to attempt to ‘iron’ out these results, it would be almost impossible to avoid them.