Risk assessment:
Hydrogen Peroxide can be corrosive if strong, and irritant to the eyes and skin. For solutions less than 18 'vol' H2O2 there is a low hazard. For all solutions to or greater than 18 'vol' but less than 28 'vol' H2O2 the hazard is irritant to eyes and skin. Eye protection should be worn during the whole experiment and it should be handled with care. Contact with skin should be avoided and clothing should be protected. Any spills should be cleaned immediately. All Enzymes are potential allergies and can irritate membranes in the eye or nose if inhaled. They may also cause an asthmatic attack. Yeast has a low hazard but all the points should be beard in mind while doing the experiment. Eye protection should be worn and care should be taken when handling with enzymes. It should be avoided handling, inhaling or contact with skin wherever possible. They must not be swallowed and if spilled it should be cleaned immediately. In addition we have to wear our hair during the whole experiment looped up.
Pilot
I carried out a Pilot test in order to find out what volumes,quantities and concentrations of Hydrogen Peroxide to use.
Serial Dilution table:
List of apparatus:
Beaker - 1.0 ml Syringe
50cm Burette - delivery tube
Clamp stand -stopper
Thermometer
Stop clock
10 cm Syringe
10 % Hydrogen Peroxide
Distilled water
Boiling tube
Text marker
Yeast
Goggles
Variables:
my independent variable will be the substrate concentration, in this case the concentration of Hydrogen Peroxide. I will vary this using serial dilution, in order to make up the Hydrogen Peroxide concentrations. The three concentrations I will use are 10%, 5% and 0% in the pilot and in my main experiment i will use 20%,15%,10%,5% and 0% of hydrogen peroxide.
my dependent variable will be the amount of Oxygen released
my variables that i will need to control are: The pH of yeast, the temperature of yeast and hydrogen peroxide,the time,volume of distilled water added into the burette, the volume of the enzyme yeast and the volume of the substrate
All of these control variables will need to be controlled by me, and to be kept the same throughout my experiment, in order to keep it fair and for the results to be accurate. I am only testing the effect of substrate concentration on the rate of reaction so the other factors will have to remain the same, so that they don't affect my results.
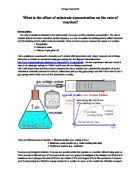
Brief Method:
- built up the apparatus
-turn the burette upside down and fill it with exactly 50 cm? distilled water
-fill the 10 cm with 10cm of 10% Hydrogen Peroxide and push it into the boiling tube
-fill the 1.0 ml syringe with 1.0 ml of yeast and put it on top of the delivery tube
-now connect the delivery tube and the boiling tube
-push the yeast into the boiling tube with the 10cm Hydrogen Peroxide and at the same time start the stop clock
-with the text marker record the result on the burette after 20 seconds
-repeat this method for 5 and 0 cm3 of Hydrogen Peroxide
Simple Prediction:
I predict that the greater the concentration of Hydrogen Peroxide, the faster the rate of reaction. The greater the concentration of Hydrogen Peroxide, the greater the volume of oxygen( the product) produced in the initial rate ( the first twenty seconds). With higher substrate concentrations the reaction will flatten out.
Results table:
Graph:
see graph paper pilot /Title: A graph to show the effect of substrate concentration on the volume of oxygen (cm ) evolved in 20 seconds
Analysis:
There is a dependency between the volume of oxygen evolved in 20 seconds and the concentration of Hydrogen Peroxide. I have three average measuring points (0.0,11.3 and 27.5) and in this case it is the best to draw a line of best-fit, because the number of measuring points is too small to draw a curve. The gradient of this line is roughly 2.5:
m=y/x=24.5/10=2.45=2.5(1 d.p.)
At a concentration of 5 cm Hydrogen Peroxide, 11.3 cm of oxygen is in 20 seconds evolved and at 10cm Hydrogen Peroxide, 27.5cm of Oxygen is in 20 seconds is evolved. When the Hydrogen Peroxide concentration increases, the rate increases at a directly proportional rate. As a result we can see that my prediction was correct, although no flattening out of my line graph is visible.
Modification:
As i did my pilot i have seen that it would be better to change a few things to make my main experiment as accurate as possible. First of all i will use five concentrations of Hydrogen Peroxide: 20 cm ,15 cm ,10 cm ,5 cm and 0 cm , instead of 10 cm ,5 cm and 0 cm as in the pilot, to see a flattening of the reaction. This increasing in concentrations makes my analysis more accurate and i can interpretate and concluse more from my graph and table. The seconds thing i want to change is the time after which i do my reading. In the pilot i used a time of 20 seconds but i have seen that after this amount of time the reaction was almost finished. Now in my main experiment i use the time of 10 seconds, which is more appropriate and so I get an amount of oxygen evolved at the beginning of the reaction and not at the end of the reaction. When i would have taken my reading of oxygen evolved in my main experiment with the same time as my pilot of 20 seconds, then the amount of oxygen would have been at 50 cm and this is the end of my burette. So probably the oxygen evolved would have been over the scale. Furthermore the temperature changed from 14.5 C in the pilot to 21.0 C in the main experiment. So i had to get cooler water in my main experiment so that both experiments are under equal conditions.
Main experiment
Detailed Prediction:
I predict that the higher the concentration of Hydrogen peroxide , the more oxygen will be produced in the allotted time. But at a certain amount of substrate concentration there will be no more increase in the production of oxygen, because i would expect that at high substrate concentration there are no more free active sites and no more enzyme- substrate complexes are formed. When there is a 100% concentration of Hydrogen Peroxide, in my case 20 cm, I predict the most oxygen will be produced or 20 cm is already the substrate concentration at which no increase is visible and the amount of oxygen will remain. Further I predict that the rate of reaction at high substrate concentration is high. From then on, as the concentration gets weaker, I predict less oxygen will be produced and at a slower rate. Furthermore I would expect 100% in volume of Hydrogen Peroxide, in my case 20 cm of Hydrogen Peroxide, to react quickest because it has the most molecules in it. With more of these molecules inside the solution, it is more likely that reactions will take place. This means that a reaction is more likely to take place in a shorter time, making the rate of reaction quicker.
After 20cm of Hydrogen Peroxide I would predict that 15cm Hydrogen Peroxide produce most Oxygen, then 10cm of Hydrogen Peroxide and then 5 cm of Hydrogen peroxide. At a 100% in volume of distilled water, in my case 20 cm , i would expect no oxygen evolving, because there is no substrate forming an enzyme- substrate complex with the enzyme.
Once the number of substrate molecules added is more than the number of active sites which are unfilled, then the rate of reaction will no longer go up. When this point is reached, adding extra substrate will make no difference to the rate of the reaction. This is because the maximum number of reactions are taking place at once so any more substrate molecules have to wait until some active sites are no longer in use. In addition I would predict that the amount of oxygen evolved would double from the Hydrogen Peroxide concentration 5 to 10 moldm and also a doubling from 10 to 20 moldm .
Apparatus list:
Table to show reasons for choice of apparatus:
Table to show the variables that must be controlled:
Serial dilution table:
Sketch:
Detailed method:
It is very important to measure the amounts of Hydrogen Peroxide, Yeast and water accurately, to ensure that it is a fair test.
-wear your goggles and loop up your hair
-set up the apparatus as in the sketch and care should be taken to avoid any gaps where the oxygen gas could escape. Be aware to fill the burette with exactly 50 cm of distilled water
-measure out 20 cm of the 20% Hydrogen Peroxide using a 10 cm syringe
-carefully push the Hydrogen Peroxide into the boiling tube and close the boiling tube with the stopper
-then mix the 10% yeast solution with the stirring staff
-measure out 1.0ml of yeast in a 1.0 ml syringe
-put the syringe filled with yeast on top of the delivery tube
-carefully push the yeast into the boiling tube (Bubbles should start to rise up the tube) and at the same time press the stop clock
-after 10 seconds mark with the text marker the volume of water left in the burette and pull the end of the delivery tube out of the burette, so that the oxygen gas is not evolving anymore into the burette
-repeat this method for the concentration of 15 cm , 10 cm and 5 cm Hydrogen Peroxide three times each
Result table:
Graph:
see graph paper
Analysis:
My graph is a curve because I thought it would be best to draw a best- fit in this case due to the amount of measuring points. The curve starts at 0 and increases steadily up to 23 but starts to stay at one place- a small plateau is formed with the last measuring point of 23.3 being on it. There is a dependency between the evolving of oxygen over 10 seconds and the concentration of Hydrogen Peroxide. As the concentration of Hydrogen Peroxide increases, the amount of Oxygen gas evolved increases. At the first concentration of 0.0 moldm of Hydrogen Peroxide the amount of Oxygen was also zero. At a concentration of 5 moldm Hydrogen Peroxide we diluted it with 15 cm of distilled water. The amount of oxygen evolved for this concentration is 7.3 cm. At a concentration of 10 moldm Hydrogen Peroxide the average amount of oxygen gas was 7.6 cm . At a concentration of 15 moldm of Hydrogen peroxide the average amount of oxygen was 20.0 cm and at the last concentration of 20 moldm of Hydrogen peroxide, the average amount of oxygen was 23.3 cm . The last value is the highest of all other values. Vmax is 23.3 cm and V(max/2) is 11.65 cm of oxygen evolved. The michaelis constant is under 5 moldm , but i cannot comment on it because it is affected by so many factors. Since the substrate concentration at Vmax cannot be measured exactly, enzymes must be characterised by the substrate concentration at which the rate of reaction is half its maximum. This substrate concentration is called the Michaelis -menten constant (Km). I have calculated five gradients and gradient 1 is m= y/x=2.4/1.25=1.92, the second gradient is 1.3, the third gradient is 0.96, the fourth gradient is 0.8 and the last gradient is 0.5. All gradients are given to one decimal place. So we can see an decrease in the gradients from 1.92 down to 0.5. Another calculation i did is the the calculation of the rate: this is each average amount of oxygen gas evolved divided by the time of 10 seconds. Resulting in the rates of 0.0, 0.76 for the average amount of 7.6 cm evolving oxygen gas, 1.87 for the average amount of 18.7 cm evolving oxygen gas, 2 for the average amount of 20.0 cm evolving oxygen gas and in the end the rate of 2.33 for the average amount of 23.3 cm evolving oxygen. As we can see there is an increase in rate from 0.0 up 2.33. Going from 5 to 10 moldm of Hydrogen peroxide the amount of oxygen gas changes from 7.3 cm up to 18.7 cm . The volume changes times 2.5 and this is as we expected in the detailed prediction. In addition we would have expected that at the concentration of 10 to 20 moldm of hydrogen peroxide ,the amount of oxygen evolved would be doubled. In our case the volume of oxygen is 18.7 and at 20 it is 23.3. This is an increase of 4.6 cm . The amount of 18.7 cm of oxygen is times roughly by 1.2 to get the result of 23.3 cm of oxygen. We would have expected that the volume would have been roughly 36 without shortage of enzymes. As the oxygen amount is less with higher substrate concentration this proofs my prediction. We can see this in the decreasing gradient( average amount of oxygen / substrate concentration). This could be due to the lack of enzymes at the hydrogen peroxide concentration of 20 moldm . At higher substrate concentrations the curve should become constant and show no increase. The result can be interpreted due to the enzymes (E)and substrate ( S) forming enzyme- substrate complexes:
E + S ES
This complex then breaking down to release the product( Pr)
ES E + Pr
Reaction one is likely to be faster than reaction two. As the substrate concentration increases the number of active sites in the enzyme that are initially engaged would rise up, up to a certain substrate concentration at which all the active sites are filled. A further increase in substrate concentration would not be able to make the volume of oxygen greater. When there is little substrate and many enzymes there are plenty of free active sites for the substrate to bind. The reaction rate is slow, just 2 molecules react per unit time together. When there is more substrate concentration, the reaction rate is higher and more enzyme- substrate complexes are formed- 7 molecules react per unit time. When there would be an increase in substrate concentration again but no more active sites available, no improvement on he rate of reaction would happen- it would be the same of 7 molecules react per unit time. The more substrate the more these molecules will bump into the enzyme, resulting in an enzyme- substrate complexes. Therefore, increasing substrate concentration increases the rate of reaction. However, when the amount of enzyme concentration stays the same then at high concentrations of hydrogen peroxide there will be all active sites already binned and the substrate has to queue up for an active site. This shows our graph at the end of the curve where there is slowly a plateau formed.
Comment on standard deviation:
My standard deviations have similar size and there is no anomalie. My lowest standard deviation is 0.0 and the greatest is o.6 at which 23.3 cm of oxygen evolved. I have got once the same values of standard deviation of 0.4 at the concentration of Hydrogen peroxide of 5 and 15 moldm . Due to the fact that there is no outlier the measured values are reliable. Nevertheless more measuring values would have resulted in a smaller standard deviation and in a higher accuracy.
Evaluation- Table to show some possible effects of limitations on the methods:
I have no anomalous results and my experiment went well. There were no major errors except the changing of the temperature which had to be noticed. After noticing i changed the normal tap water into cooler water to make it a fair test. I can be confident of my results because there are no anomalous and there was no great inaccuracy. In another experiment i would have probably used a gas syringe instead of the burette, because it was quite difficult to fill the burette with exactly 50 cm of water and to make sure that no oxygen will be lost. The construction between the end of the burette and the delivery tube was not as accurate as it could be and maybe some oxygen was lost there. My results are all very similar at the same concentration and are precise and reliable. The standard deviations of the measurements are are all similar small, but it would have been more accurate to use more readings for same concentrations to increase the significance of the experiment. Further it would be good to have results with the volume of Hydrogen Peroxide using 30 or 40 cm to make sure my experiment was correct and the results are as expected ( the curve of formed oxygen levels off at higher substrate concentration).
Bibliography:
advanced biology - Jones and Jones
advanced sciences - biology 1
Biological Sciences 1 and 2
advanced biology – Michael Kent
the class notes
the Internet: www. Wikipedia.com