(Diagram)
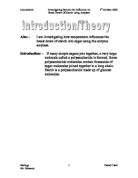
Scientific reason for the prediction
From the information, I knew the heat could change the shape of active site, and that lower temperatures cause the molecules to move slowly. From the “graph 1” I know the best temperature to break down the starch is about 70 degrees C, and below 15 degrees C and above 84 degrees C the reaction stops or continues very slowly, (information from the table 1)
Diagram and equipment list
Equipment list:
- One pair of tongs.
- Two beakers.
- One test tube.
- One pair of safety glasses.
- One Bunsen burner.
- Two teat pipettes.
- A spotting tile.
- A stop clock.
- A heatproof mat.
- A tripod.
- Gauze.
- One thermometer.
- Iodine solution.
- 5 millilitres (ml) of starch solution.
- 5 millilitre (ml) of enzyme solution.
Draw the diagram:
Step by step plan (method)
First experiment the temperature is 0 degrees C.
- I will put 5 ml of amylase solution in to the test tube and put a thermometer in to the test tube.
- I will put the test tube in to iced water in a beaker.
-
I will wait for the temperature of the amylase solution to reach 0°C then I will put 5ml starch solution in to the test tube with amylase solution.
- I am going to start the stop clock just after added the starch solution.
- I will use a pipette to get some amylase and starch solution in to the dimple tray with one drop of iodine solution every 30 seconds to test the colour changing.
- When I see the colour has changed from black to orange then I am going to write down the time it takes.
- I am going to measure the temperature at the end and stop the clock.
I will repeat this method at different temperatures to find out the quickest time to complete this experiment.
These will be 30°C, 40°C, 50°C, 60°C, 70°C, 80°C, 90°C and 100°C.
I will make the amylase reach these temperatures by heating the water as show in the diagram.
Accuracy
-
Record exact temperature in °C at the start and end and find the average.
- Use a stopclock to read the time every 30 seconds.
- Measure 5 ml starch solution + amylase solution using syringes.
- Always use 1 drop of this mixture to test every 30 seconds.
Fair test
In the all of different experiments I will change the temperature only. I will keep the volume of starch and amylase solution same. I will always use 1 drop of iodine solution. I will use the same apparatus for every experiment.
Reliability
If I did any thing wrong with my experiment I will do it again. For example if the temperature is wrong or volume of the any type of solution. I will know if result is wrong because it will not follow the same pattern as the rest. I will compare my results with other students to see if I get same pattern.
Analysing and concluding
Conclusion
When I look my graph for table three I think the optimum temperature was 69°C, it took 80 seconds to break down the starch. But I found out another quickest time’s temperature from graph for table five, it is 75°C.
The graph from table three does agree with my prediction because the optimum temperature is between 60 degrees C and 70 degrees C but the graph from table five does not agree with my prediction because the optimum temperature is over 70 degrees C.
My accurate graph from table five does give a similar optimum temperature to the preliminary graph from table three.
I think the graph for table 5 is most reliable result. That is because the table five shows the result in detail and more accurate because the gap between two temperatures are mush small than graph for table three. Table three is the basic result we used, after we roughly knew the best temperature is about 70 degrees we did some experiment for table four and five to find out the result more accurate, so I believe that graph for table five is most reliable result.
The scientific reason for this is:
Low temperatures
The reaction takes a long time to breakdown starch. Below 28°C the enzyme work so slowly it took more than 10 minutes (this result is from table one) to break down the starch.
- Molecules move slowly into active sites.
High temperatures
-
Above 95°C the enzyme did not break down starch. This is because the heat changes shape of active site. This is because the molecules are vibrating very quickly. The enzyme is denatured.
Evaluation
My procedure was successful because I found an accurate optimum temperature that was close to the preliminary optimum temperature. My evidence is reliable because the temperatures I plotted were the average of start temperature and end temperature.
I have an odd result on table five graph and another odd result on the table three graph I am not sure why these results are wrong.
To make the result more reliable I could use an electric heated water bath that would stay at the temperate I wanted exactly.
Some of the temperatures that I plotted may not be very accurate because I use the average of start temperature and end temperature.
I do not think my evidence supports a strong conclusion because the table three graph and table five-graph gave optimum temperatures that are 6 degrees C different.
I could extend this enquiry by testing other enzymes and by testing for temperatures every 2 degrees C between 66 degrees C to 80 degrees C.