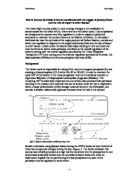
In order to conduct this experiment, I will use leaf discs submerged in Sodium Hydrogen Carbonate, NaHCO3. This is an indicator that changes colour from orange to deep purple. The colour change shows a decrease in CO2. Therefore, as photosynthesis begins, it uses CO2 from the indicator and so CO2 will be reduced from the indicator, resulting in the colour change.
According to the above, I will predict that the quicker the colour change, the faster the rate of photosynthesis will be. However, in sun leaves, high light intensity will fasten the colour change as they are more adaptable to high light intensity. Whereas in shade leaves, high light intensity will not fasten the rate of photosynthesis, rather it may damage the leaf discs if exposed for long. Therefore, I will predict that for shade leaves, high light intensity will not fasten the rate of photosynthesis.
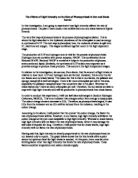
Having said this, light intensity is directly proportional to the rate of photosynthesis (in sun leaves) only to a point. The graph below shows that the line levels off at a point where the optimum level for light intake is reached. At this point, there must be other limiting factor other than light intensity that limits the rate of photosynthesis. These factors could be temperature and carbon dioxide supply.
Diagram courtesy of BBC Bitesize
My variable will be the light intensity. The light source will be placed at different distances to the sample.
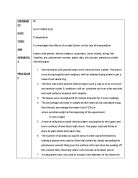
My constants will be the same volume and concentration of the indicator. The leaf discs will also be the same shape and size and the temperature will be kept at constant. I have chosen the room temperature, 25˚. The reason for this is that enzymes in the chloroplast work best between 20˚ and 37˚. Temperatures above this boundary will cause the enzymes to denature and so cease to function. I will also ensure that the same source of light and stopwatch is used.
The unfortunate setbacks for this experiment will be that I won’t be able to control the thickness of the leaf discs; this will undermine the density of chloroplasts when compared with other leaf discs.
I will repeat this experiment 3 times for each type of leaves. However, I will place only one disc at a time in the syringe, the reason being is that if I insert more than one disc than there will be a tendency for the discs to overlap each other. This will affect my results as some chloroplast will be blocked from the source of light, disabling them to photosynthesise. I will than record the average values for my analysis.
Risk Assessment: the only chemical being used for this experiment is NaHCO3. This chemical is hazardous and should be handled carefully. If in contact with skin or eyes, than area of contact must be washed thoroughly with water immediately. If irritation persists, than contact a medical doctor immediately.
Apparatus:
- Hyptis Emoryi plant
- Straw
- Six 10ml syringes
-
0.2moldm-3 NaHCO3 solution
- Lamp
- Ruler
- Stopwatch
Method:
- Using a sun leaf, cut a disc from the leaf with a straw
-
Add 10cm3 of NaHCO3 into an open syringe
- Place the disc into the syringe and carefully re-install the plunger in the syringe.
- Get rid of any air spaces inside the syringe by pushing the plunger.
- then, blocking the nozzle firmly, pull the syringe back until air bubbles from the disc are shown
- The disc should then sink to the bottom of the syringe as it’s denser.
I will repeat steps 1-6 for each leaf discs.
Then;
- I will place the syringe 10cm from the lamp and start the stopwatch.
- I will stop the stopwatch as soon as the colour of the indicator changes from orange to deep purple.
I will repeat step 7-8 for distances of 20cm, 30cm, 40cm and 50cm.
Table of Results:
Graph:
Bibliography
-
Safety Assessments for NaCHO3, date accessed 28th October 2008
-
Factors limiting Photosynthesis, date accessed 28th October 2008
-
Affects of Light Intensity on Photosynthesis, date accessed 28th October 2008
-
Limiting Factors in Photosynthesis, date accessed 29th October 2008