From the results taken in the trial of the experiment the following table was devised:
The quantities 1/R and 1/L were calculated as to find a good estimator of r a straight-line graph would need to be plotted the graph would come from the following rearrangements of the formulae and substitutions we get the formula:
1/R = lo/r × 1/l – 1 /r
The following lines show how the formula is obtained:
For the cell,
Eo=klo (equation 1)
When R is in the circuit no current flows through the bottom cell so that the voltage across its terminals drop to VAB,
VAB = kl (equation 2)
As the wire is made of the material throughout (ρ = constant) and the same cross sectional area A and the current I has remained the voltage gradient, k is the same in both cases,
∴1/2 gives Eo = klo
VAB kl
Eo = lo
VAB IR (equation 5)
As the p.d. across the cell is equal to the p.d. across the resistor you get,
VAB = IR (equation 3)
Applying the circuit equation to the bottom loop you get,
Eo = I(R+r) (equation 4)
On sub substituting in equation 5 you get,
I(R+r) = lo
IR l
As the current is the same you get,
(R+r) = lo
R l
Through further substitution,
(R+r) = R(lo/l)
r = R(lo/l) –R
r = R( ( lo/l) -1) )
From which r can be found as R, lo are known,
r = R( ( lo/l) -1)
r = lo – 1
R l
And after further substitution you get,
1 = lo × l – 1
R r l r
Which is in the form of y = mx + c
So then a straight-line graph of 1/R against 1/L could be plotted. This graph would be used to calculate the gradient of the graph and therefore the value of constant r. Which could be found by rearranging the equation and using information from the graph as shown above.
The intercept on the y-axis will be the value of 1/r so the value of r can be easily found using this fact.
Apparatus
Potentiometer wire with meter rule, ammeter, resistance box, variable resister, driver cell, cell of unknown internal resistance, galvanometer, two switches, wires and a jockey, multimeter.
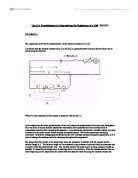
Circuit Diagram
The following diagram shows how the galvanometer was read from directly above to avoid any parallax errors:
Results Section
Characteristics of Instruments
These show the characteristics of the instruments that were used in the experiment they were taken before the experiment was conducted:
Trial Readings
These were the trial readings taken before the experiment, they were taken to help in the decision of the size of the limits. They were used to make sure the results we were getting were reasonable and that the lower and upper bounds produced comparable results that could be used in the graph.
Main Readings
Procedure/Method
When planning the experiment, there were two methods of obtaining information about the internal resistance of the cell, which were discussed one being the one decided upon. The other being a circuit based on the circuit equation. This experiment was chosen over the other one, as there were practical problems as a voltmeter would have to be in parallel with the cell and as it would not have ∞ resistance it would over complicate the experiment and give rise to less accurate results.
The procedure in the experiment was as follows:
- The apparatus was set up as shown in the diagram.
- A resistance was set on the resistance box the resistance was then checked using the multimeter. Observers of the balance length were then taken, the galvanometer was read from directly above to avoid any parallax errors.
- Once one observation was recorded another resistance was set on the resistance box (observations were taken going up the resistance scale and then on the way down again to make sure there was no bias to results).
- Then the apparatus was disassembled and put safely away.
Calculations/Derived Quantities
To find the value of r the following calculations were made:
Firstly the y intercept (which is equal to 1/r) was found from the graph, it was found to be –0.1917 Ω-1.
This could then be used to find the value of r:
r =1÷ 0.1917
r = 5.2165 Ω
To find the uncertainty in r error bars were plotted on the graph and were used to find the maximum and minimum values of r as follows:
For the minimum value, the maximum value of 1/r was used as follows:
r =1÷ 0.3073
r = 3.2541 Ω
For the maximum value, the minimum value of 1/r was used as follows:
r =1÷ 0.063
r = 15.8730 Ω
Using these results it is now possible to give the result of the experiment giving an absolute error:
15.8730 + 3.2541= 19.127
19.127 ÷ 2 = 9.564 Ω
∴ the result form the experiment is that r = 5 +/- 10Ω
Conclusion
The graphs show that the formula, 1 = lo × l – 1 does indeed give a straight-line graph of form Y = mx + c.
R r l r
The graphs show that the value of r = 5 +/- 10 Ω.
The objective of this experiment was to determine r of the cell which has been done within the limits, +15Ω and -5Ω.
Critical Analysis of Results
The experiment could have been improved in the following ways:
- More readings of l could have been taken to give a better average.
- A greater range of resistance could have been used to get a more accurate trend line for the graph.
- There could have been more time for the experiment, so that the readings etc would not be so rushed.
- A longer potentiometer wire could have been used to give less percentage error as the balance length would be longer.
- The contact resistance in any connections could be reduced by using soldered joints or cleaning contacts.