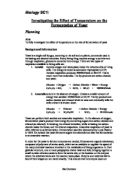
Planning
8g of sugar was dissolved in water in a 250 cm3 beaker and 15g of yeast was mixed with that. This was left for 10 minutes for the yeast to become active. Some of the yeast mixture was then transferred to a test tube along with Ph buffer. Six different Ph levels were used. A delivery tube was attached to the end of the tube and the other end was lowered into a beaker full of water. The gas produced was then measured every ten minutes.
I predict that the fermentation level of the yeast will be at its optimal rate at Ph 7 (neutral level) because it is neither too acidic or alkaline. The fermentation level of yeast will be at its lowest at Ph 11, or higher.
List of equipment:
- Yeast
- Petri Dish
- Test Tube Rack
- Sugar
- Weighing Machine
- Ph Buffers at Ph 3, 5, 7, 9, 10, 11
-
10 cm3 graduated pipette
- Boiling tube with bung an delivery tube
-
250 cm3 beaker
- Clamp
-
10 cm3 measuring cylinder
Preliminary Work
Before the actual experiment, preliminary work was. The method below was used.
Method
-
Dissolve 1.6g of sugar in 10cm3 of warm water (about 400 C) in a test tube.
- Add 3g of yeast and stir well, and then add ph buffer.
- Leave for 5mins for yeast to become active
- Measure amount of gas produced
- This was repeated for 6 different values.
The test tube full of yeast was placed in a clamp stand and a bung was fixed on top (and was connected to a delivery tube) and the gas was collected under water in a beaker using a 10cm3 measuring cylinder.
Preliminary Results
Ph 7
Ph 9
Modification of preliminary work
After the preliminary work, I decided to make a few changes. Firstly, I decided to only note down the volume of gas produced for every 5 minutes. Secondly I decided to ferment the yeast in a beaker and then transfer the yeast using a pipette into a test tube. 15cm3 of yeast and 15cm3 of Ph buffer were used so that the test tube was just about two-thirds full so that there was sufficient gas being produced. Also, I decided to wait until the first bubble of gas was produced and then I started timing the experiment. Each Ph value was repeated twice so that there were three values in total.
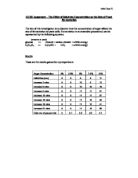
Table Of Results
Ph 3
Ph 5
Ph 7
Ph 9
Ph 10
Ph 11
None of these Ph values gave a value of nought so I did one last experiment at Ph 12.
Ph 12
Evaluation
By looking at these results and the graph, it is clear that my prediction was correct and that the rate of fermentation is at its peak between Ph 6.5 and 7. Also, as the rate of fermentation does decrease dramatically when the Ph level is too high, e.g. 12. By looking at he graph, you can see that this is true because the line ends as a horizontal one, because it has reached its limit. It levels out, because there is a limit to the rate of fermentation. If I had carried out another reading, of Ph 13, then I would find that it would be the same as Ph 12, and no gas would be produced.
There are a few anomalies on my graph, and these have been circled with red pen. A better graph could have been drawn if more results had been taken (more Ph values), but it was inaccurate to measure exactly how much gas had been produced, whilst waiting for the first bubble to appear. Also, Ph testing paper was used, to test the exact levels of Ph buffer and it was found that Ph 6 was more like Ph 5, and also, other Ph buffers were not precise.
To improve the experiment I would use better measuring equipment to measure the amount of gas; make sure that I had the exact amount of yeast and sugar, and also make sure that the Ph buffers were not polluted.
Further Work
For further experiments, I would consider changing the amount of sugar, to see if that affected the rate of fermentation and would take six different values of sugar. Another way of extending the investigation is to use different temperatures to see if that affects the result. I would use a Bunsen burner, and change the air-hole for four different values and then use ice and finally leave it at room temperature.