Diagram of apparatus used.
What did each test tube contain?
Test tube 1 contained enzyme and milk to a ratio of 1:1
Test tube 2 contained enzyme and milk to a ratio of 1:2
Test tube 3 contained enzyme and milk to a ratio of 1:3
Test tube 4 contained enzyme and milk to a ratio of 1:4
Results
What do the results show?
As you can see, using the table above, that as you increase the ratio of the milk to enzyme, it takes longer for the milk to turn cloudy. From this preliminary experiment I am going to vary the enzyme concentration using the ratio of 1: 3 (enzyme: milk) because I concluded from my results that 2.38 min and 4.5 min is too short of a time to record, and more than 10 min is far too long.
During the course of this experiment I have noticed that when I poured the various amount of solution (i.e. 20 cm 3) it nearly filled the whole of the test tube. This caused a few problems. The biggest of all was that when you shake the test tube throughout the course of the experiment. I shook the test tube whilst keeping my thumb over the top of the test tube.
When I had finished shaking it and I took my thumb off the test tube, there was still some solution on my thumb, i.e. reducing the level of the solution in he test tube. To resolve this issue will now keep the volume of solution in the test tube as 8 cm 3. This is because 8 cm 3 of solution will be enough solution to tell when the solution has became clear ( i.e. when the black ruler is visible clearly)
Other people decided that they are going to keep the independent variable as the temperature of the experiment. I think that this method would produce anomalous results because, when you want to heat the test tube containing the 1% trypsin and 4% milk, you must place it in a water bath (at a designated temperature.) But, when you have to check the solution if it has gone clear (i.e. taking the test tube out of the water bath) you would automatically reduce the temperature of the experiment, and in my opinion, the results would be inaccurate possibly causing anomalous results.
Ensuring a fair test
Probably the most important aspect of any experiment is ensuring that you have prepared and will carry out a fair test. In this experiment I have a number of controlled variables (i.e. variables that cannot be changed.)
- In my opinion, the measurement of milk and trypsin is the most important part of the experiment, and should be measured out with great care. Inaccurate results will definitely be produced if this procedure is not carried out with caution.
- One has to make sure that the concentration of the enzyme trypsin (1%) does not come into contact with the milk (4%) before the experiment has started, because the enzymes will start to digest the casein in the milk before you have started to record the timings.
- The same substrate, milk (4%) will be used throughout the experiment.
- The same volume of solution containing the concentration of enzyme and milk will be kept the same throughout the course of the experiment.
- Subsequently, the same size test tubes will also be used throughout the experiment.
- I will have to be very punctual in the way that I record the times and when stopping the stopwatch.
To ensure that the results are accurate and precise I will repeat the experiment 3 times, and I will take the average.
Risk assessment
Again safety is another very important factor, which can affect an experiment.
- Goggles shall be worn throughout the experiment.
- Caution and patience shall be taken whilst measuring out the various volumes of solutions
- All bags shall be placed underneath the table, and stools shall be carefully tucked in, so that they are not in the way of anybody.
- Once the experiment is completed, good care shall be taken whilst handling the test tubes and beakers and putting them in the desired places.
- Overall, care and precaution shall be taken throughout the course of the experiment.
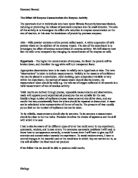
Experimental prediction.
The enzyme trypsin is a biological catalyst, as it speeds up the rate of reaction, however it does not get used up or get involved in any way shape or form during the course of the reaction. Enzymes at high temperatures become denatured, which basically means that they are not able to work to their maximum ability. In this specific experiment, the substrate was casein and the product that was eventually produced was amino acid. I predict that as the concentration of the enzyme solution decreases, the rate of reaction will also decrease, consequently the time taken for the solution to become clear will increase. This simply means that at high concentrations there will be a greater possibility of ‘trypsin’ molecules colliding with the milk, and therefore reacting. These reaction rates are explained using the collision theory, which states that a rate of reaction depends on how hard and how often the reacting particles collide with one another. Particles have to collide hard enough to react.
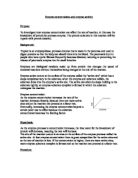
As you can see from the diagrams above that at a high concentration the particles are more likely to collide with one another than, a solution of normal or low concentration. These diagrams hopefully demonstrate the collision theory.
I basically believe that when the concentration of enzyme solution is increased, the rate of reaction will also increase. In this experiment, as the trypsin is added to the milk there are numerous collisions with the casein, caused by kinetic energy. When the trypsin later collides, it causes an active site. The product, which in this case is the substrate molecule (milk) is forced onto the enzyme molecule. As this happens, trypsin (enzyme solution) eventually produces amino acids, which are soluble in water, and that is what makes the milk become clear.
Nevertheless, the rate of reaction should decrease as the experiment develops, i.e., when the concentration of trypsin decreases. This can be explained by the fact that when there is a small concentration of trypsin, there are fewer particles with the required activation energy (EA). This basically means that there are fewer particles to collide with one another, slowing down the reaction as a whole. Therefore I can clearly predict that the percentage of trypsin will be indirectly proportional to the time taken for the casein to be digested. I also predict that the increase in concentration of the enzyme solution will be directly proportional to the increase in reaction rate.
Dilutions of the enzyme solution.
Method.
Apparatus to be used
- Various percentages of enzyme solution
- Milk (4%)
- Measuring cylinder
- Beaker
- Bench mat
- Test tubes
- Test tube rack
- Distilled water
- Sticky labels
- Stop watch.
- Firstly we will set up the experiment, using the apparatus above
- We will then draw out a simple table in which the results can be easily recorded.
-
We will then pour 5 cm3 (as accurately as possible) of 1% enzyme solution into the test tube. We next will pour out 15 cm3 (as accurately as possible) of Milk (4%) into a separate test tube.
- We will then get the stopwatch ready, and as soon as the two solutions will be poured into a single test tube, we will star the stopwatch and commence the experiment.
- During the course of the experiment we will constantly shake the test tube to make sure that the solutions will be in proper contact at all times.
- This action was carried out until we could see a black ruler clearly through the test tube (i.e. until the solution became clear/transparent.)
- Once the experiment was finished we stopped the stopwatch, recorded the time and poured the solutions into the sink.
Obtaining Evidence.
Below is the table of results. This table shows the reactions between trypsin and milk at various concentrations and the time taken for the experiments to complete.
Below is the table showing the average results for the reactions between trypsin and milk at various concentrations and the average time taken for all the experiments to complete.
I have highlighted the 0.00 concentration of trypsin because in every experiment there is a control. I have kept a control in this experiment because I just wanted to see if the milk went clear. If it did than I know that there is a flaw in the experiment because if there is no enzyme solution than how can the milk turns cloudy?
Analysis
By looking at the results that I obtained in my observation section and by analysing my graphs, I can say that my initial prediction was correct. This prediction was that the percentage of trypsin would be indirectly proportional to the time taken for the casein to be digested. This pattern/trend was definitely present in my 1st graph.
For the first graph, average time taken for the casein to be digested against the average percentage of enzyme solution, a curve was produced. It can be said that the theory behind the prediction made in the planning section was definitely correct. From the graph you can see that as the percentage of trypsin was increased, the time taken for the casein to be digested decreased. This can be explained by the fact that when there is a smaller concentration of enzyme solution, there are fewer particles with the required activation energy (EA) colliding with each other. This basically means that the whole reaction will be slowed down as a whole. However, when there is a high concentration of enzyme solution there will be more particles colliding with one another at the required activation energy (EA), therefore the reaction as a whole will speed up.
Another theory to why, at a higher concentration/percentage of enzyme solution, the time taken would decrease because, when the trypsin particles collide with the casein particles, it creates an active site. The casein is then forced into the enzyme molecule. The greater the percentage of trypsin, the quicker the substrate molecule (Casein) would be locked in. consequently, the trypsin the produces soluble products called amino acids.
For the 2nd graph, the average rate of reaction against average percentage of trypsin, a curve was also produced. This curve can be interpreted that the rate of reaction was proportional to the percentage of trypsin. The theory behind this graph is almost the same explanation as the last graph, except that instead of the time take. The rate of reaction increases as the percentage of trypsin increases. The way that this graph slightly differs from the 1st graph is in the way that the time taken is indirectly proportional to the concentration of trypsin, whilst in this graph, it can be said that the rate of reaction is proportional to the percentage of trypsin.
To conclude, my initial prediction was correct as well as my theory behind it. To summarise these graphs, it can be said that the experiment with a lower percentage of enzyme solution took longer to react with the substrate (Milk), therefore the rate of reaction was much slower than the reactions with a higher percentage of trypsin.
On both graphs a line of best fit was drawn (as accurately as possible). However, some of the results could have been a bit of down to human error. This will be explained/explored in the evaluation section. No real anomalous results were obtained.
Evaluation.
Throughout the experiment it was evident that the method used was fairly accurate and correct, and seemed to be reasonably successful.
The results produced by this experiment were fairly accurate and reliable; this thinking is supported by the graphs, shown in the analysis section. As a result of these results obtained, no real / obvious anomalous results were produced. This is probably due to the fact that I took a sufficient number of readings for each concentration of trypsin used, which then allowed me to calculate an overall average for the results of each concentration. These accurate and consistent results helped me to distinguish the patter / trend of the results in the graph. I discovered that as the percentage concentration of enzyme solution increased, the time taken for the casein to be digested decreased.
Analysing the method.
I feel as though the method used was a reasonable method.
- To measure the volumes of trypsin and milk, separate measuring cylinders were used to ensure that reliable results were produced.
- To identify the termination point of the reaction, we placed a black ruler behind the subsequent test tube. When we could see a clear black ruler through the test tube, we decided to terminate the experiment, consequently stopping the stopwatch.
Limitations
I believe that the method used was reasonable, but every experiment has its limitations. In this experiment the main limitations were
- Measuring the volumes
- Not a suitable method in end point termination method.
-
I believe that the method whilst measuring the volumes of milk and trypsin had its limitations because we were only given measuring cylinders to measure out the various volumes. Measuring cylinders are a fairly accurate way of measuring volumes, however, measuring cylinders could have been replaced with syringes. Syringes are much more accurate. For example, when measuring 2.5 cm3 of enzyme solution in a measuring cylinder, you very easily accidentally measure 2.3 or 2.6 cm3without even noticing it. However, when you use a syringe and you measure volumes like 2.5 cm3 of enzyme solution, it becomes much more easier, quicker and most of all more accurate.
- I believe that the method used to find out when the end point determination method had its limitations because; you have to keep an eye on each and every test tube that has enzyme solution and milk in it. There are three reactions to do for each concentration and five concentrations. So, it becomes humanly impossible to be punctual when you can see the black ruler, because there are so many experiments taking place at the same time.
If I were to extend the experiment further in the future, I would possibly repeat the experiment, using a similar method, but with a greater number of concentrations. This is because in my experiment I only used 5 different concentrations of enzyme solution. Next time I could possibly use concentrations of 2.0%, 1.5% or 0.2%, 0.4%, 0.6% etc. I could possibly even vary the concentration of the substrate (casein). By doing this, I would be able to discover a connection between the enzyme solution and the substrate.
When the experiment is carried out again in the future, to improve the reliability of the results, I believe that it is necessary that various factors be considered. Although no obvious anomalous results were produced, there may have been some external factors, which affected the reliability of the data.
The 1st being the temperature of the surroundings. The temperature of the experiment has to be left constant because if that changes then it will affect the rate of reaction greatly, which will have detrimental effect on the experiment and especially on the reliability of the data. In the future it is necessary that the temperature is kept constant, so, next time if I do this same experiment I would keep the test tube in a water bath. In this way the temperature would stay constant.
In conclusion, both my initial predictions were correct and the actual theories behind the predictions were correct. The higher the percentage of enzyme solution, the time taken for the substrate to be digested would decrease.