Prior to the planning of this experiment, an experiment was conducted. This experiment is very similar to the one done previously, in the sense that absorbance and glucose concentration was also being tested for. There was one ‘unknown’ in the initial experiment, but in this case there are to be three. These three unknowns are to be the samples of fresh orange, lemon and grapefruit. From the graph I would then find the concentration of glucose in these samples. From the results from the initial experiment, the general pattern that was observed was that the absorbance decreased as the concentration of glucose decreased. From this initial experiment, I can give myself a rough idea to how much my range shall vary from. Knowing that there is going to only be 4% of glucose given, it can be said that this will be the limit of the range. It will then be diluted each time.
To find out a rough estimate of how much they should contain, research showed these figures of glucose in these fruits. The following figures are taken from ‘Manual of Nutrition’ by MAFF. This book was published in 1945. To make sure that these figures were correct, another book was checked which was published more recently in 1997, ‘Food Science, Nutrition & Health’ by Brain A Fox & Allan G Cameron.
The figures given were as follow:
From this table, I would suggest that the fruit that would have the highest percentage of glucose is orange. Prior to the experiment, I have also checked on these fruit juice cartons and orange does have the highest amount of sugar in it.
Glucose occurs naturally in fruit and plant juices and in the blood of living animals. Most carbohydrates in food are converted to glucose during digestion. Glucose syrup (liquid glucose) results from the hydrolysis of starch (usually maize or corn starch) and is a mixture of glucose, maltose and several more complex sugars. Although glucose is the sugar present in the highest concentration, this syrup is less sweet than pure glucose and is used in some manufactured foods such as sugar confectionary. Research shows that the more sugars that are present, the more colour change.
Taken from www.kingshurst.ac.uk
The dependant variable in this experiment will be the reading on the colorimeter of the different percentages of glucose. This is what is to be controlled, as we shall be given 4% of glucose concentration measured prior to starting the experiment.
The independent variable in this experiment is the concentrations of glucose exempt the three fruits. The three fruits cannot be considered as being independent variables as they have their own concentration of glucose and these concentrations cannot be altered, so there is no control over it. Whereas the glucose concentrations can be altered by
dilution.
For this experiment to remain a fair test, some aspects will have to be looked at closely. Firstly, the whole experiment will have to take place in one time period in one day, and not split up i.e. not to be left for a long time, like overnight. This could affect the experiment as time (which is also a variable), as time was not kept regular and the solutions could have been affected somehow. When measuring the solutions, care will have to be taken. When using the graduated pipette, it would have to be made sure that there are no air bubbles taking up space affecting the measurements. This is resolved by using the pipette correctly. The glass rod will have to be cleaned after every time it has been used to stir solutions. This is as some solution could stay on the rod and when it is used to stir the next test tube, it could affect the solutions. Whenever I put a number of test tubes in to a water bath, I will place them in a rack, then place the whole rack in the water bath and on removing, remove the whole rack. This will ensure that all the test tubes have had the same amount of time in the water bath.
To make an experiment valid, there should be a range of about 5-10 tests. Altogether in the whole experiment, there shall be eight tests conducted. These are made up of five tests of the serial dilution and the three fruit acting as unknowns.
If care is not taken into when doing the experiment, the results obtained shall not be legitimate as they may be wrong. When actually reading the results, care will have to be taken of how they are read e.g. the highest reading on the colorimeter because the reading may not stay still. Measuring the solutions will have to be done properly with care. If the solution volumes tend to change and not be accurate of one test tube, the rest of the test tubes will be affected too. The water bath will have to set to exactly 100°C. the tubes should only be placed in the water bath when the water has reached 100°C and it should remain that temperature throughout.
The graduated pipette is accurate as it is suitable for measuring small quantities. To gain accurate results from the colorimeter, the cuvettes will have to be wiped and cleaned properly on the sides where the light is to pass through so that the beam of light can pass through without being refracted by smears.
To make this experiment reliable, the experiment will have to be repeated at least three times, so at the end, an average can be calculated for each different concentration. This would be useful as from analysing the results, it can be said whether the different results are close to each other. If the results are to be different, they should only be by roughly 0.01. The same volume will have to be taken from each juice from the fruit and should all follow the same process.
As choosing the colorimeter rather than the Buchner flask will make the experiment more reliable. This is as the Buchner flask involves using a filter paper, which is not very reliable. This is because the filter paper still lets through some of the solute, which would lead to giving the wrong results
During the experiment, lab coats should be worn at all times so if in any case substances do spill, they do not spill on clothes. When the water bath is set at 100°C, care should be taken when removing and placing the test tubes in the water bath. The test tubes will tend to be very hot and may burn the skin if not handled properly. The only risk assessment mentioned in safety booklets for this experiment is for the water bath. All the chemicals and solutions used in this experiment, no risk is opposed to anyone.
From the table taken from ‘Manual of Nutrition’, predictions can be made from it. The fruit expected to have the most concentration of glucose in it is orange. Following orange would be grapefruit followed by lemon. The general prediction that can be made is that higher the concentration of the glucose, the higher the absorbance reading will be obtained.
To make a 4% concentration of glucose, 4 grams of glucose would be dissolved in 100ml of water. The answers of the glucose must be expressed in mg/cm-3. It can be calculated from the following information: g/l (grams per litre) = mg/ml (milligrams per millilitre) = mg/cm3 (milligrams per centimeter) or the steps are kg g mg, with 1kg = 103g and 1 mg = 10-3 g, and 1L = 1000cm3.
Method:
- Using the chinagraph pencil, label the test tubes 1-5 near the top of the first 5 test tubes. On the remaining three, label them with lemon, grapefruit and orange.
- Using the graduated pipette, pipette 8mls of 4% glucose solution into test tube 1. This should then be labeled ‘4%’.
- Remove 4ml of the 4% glucose solution from test tube 1 and place it into test tube 2. Now add 4mls of distilled water to test tube 2. This should be done using a graduated pipette. Stir test tube 2 with a glass rod. This should now be labeled ‘2%’.
-
Remove 4ml of the solution from test tube 2 and add it to test tube 3. Fill up the test tube up to 8mls using distilled water. This is known as serial dilution*.
- Remove 4mls of the solution from test tube 3 and add it to test tube 4. Fill up the test tube up to 8mls using distilled water. This should be repeated for test tubes 5 accordingly. On test tube 5, remove 4mls of the solution and dispose of it.
- Make sure that all the test tubes all have the same amount of volume of solution in them.
- Using the graduated pipette, pipette 40mls of Benedict’s solution into each test tube.
- In the remaining three test tubes, place the three different samples in there.
- Place all the test tubes into the water bath and leave them there for five minutes.
- Compare the colours in each tube and record the results into a table using coloured pencils. This is recording the observation colour.
- Take samples of each test tube one by one and find their absorbance reading using the colorimeter (instructions for the colorimeter are shown below). Take down the readings in the form of a table.
- Draw a graph with the absorbance readings on the y-axis and the glucose concentration on the x-axis. This should be done very accurately as other results will be deduced from this graph.
- Place 6ml of each of Benedict’s solution into each of the fruit juices test tubes. Stir with glass rod and repeat the steps for the colorimeter.
- When the readings have been given for the fruit juices, the figures should be lined up on the y-axis and the figure should be taken from the x-axis, which would indicate the glucose concentration of these juices.
The whole experiment should be repeated three times so that an average can be obtained. Then the average can be calculated and then tabulated to give the best results. By reading the results of the fruits off the graph each tie, can indicate whether the experiment is going well or not.
*A serial dilution is a series of simple dilutions, which spreads the dilution factor beginning with a small quantity of material – in this case it is glucose. The source of dilution material comes from the previous dilution.
How to use a colorimeter:
- Switch on the colorimeter after plugging it in. Wait for about five minutes for the bulb to warm up.
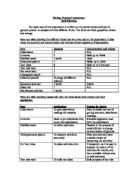
- Choose the correct filter which is required. This is chosen by the colour of the substance that is to be measured using the following table:
- Fill up a cuvette with distilled water up to ¾ full. Place this in the slot and set the scale to zero.
- Adjust the sensitivity on the read out device.
- Using the same cuvette in the same orientation do all the tests. Using the same cuvette decreases chances of incorrect results as other cuvettes may absorb more light or may be thicker/thinner.
- After each sample, rinse out the cuvette as this prevents the next sample being diluted more. Make sure the outside of the tube is dry before it is placed into the colorimeter.
The following table shows all the quantities of the different solutions used in the experiment
The following shows the table that would be used when taking down the results of the three repeats (#1 being the first experiment and so forth).
The following shows the table that would be used to show the average results of each glucose concentration.
When the average results have been calculated and been tabulated, a graph can be drawn. From the graph, conclusions can be made if there are any trends or patterns. From the graph, anomalous results can be pointed out and can be discussed to why these occurred. The dependent variable goes along the y-axis, which are the absorbance readings and the independent variable shall be along the x –axis, which is the glucose concentration measured in mg cm-3.
This is the structure of the graph on which the results will be recorded.
y-axis
Absorbance
x-axis
Concentration of glucose mg cm-3