R1 + R2
The calculations above prove that the electromotive force (Vin), in a potential divider circuit is divided across each resistor according to the ratio of resistances.
The resistors used in a potential divider circuit do not necessarily have to be fixed in value, thermistors, rheostats, light dependent resistors and light emitting diodes may be used.
My Sensing Circuit
My potential divider circuit consists of a Negative Temperature Coefficient thermistor connected in series with a fixed resistor across a 5V source of electromotive force (a power supply unit). A voltmeter will be connected in parallel across the thermistor to measure the potential difference across it.
Equipments used: Power supply unit, scissors, cellotape, cotton wool, two beakers, a data logger with two temperatures sensors, a Negative Temperature Co-efficient thermistor, a multimeter and an electric kettle
(Circuit shown on next page)
Note: The thermistor is represented by the symbol below in a circuit
Determining the value of the fixed resistor
The value of the fixed resistor in my potential divider has to be one that gives a the largest variation in output voltage within my temperature range (30°C - 60°C)
- In determining the value of the fixed resistor, I first took out the negative coefficient thermistor from the circuit and connected a digital multimeter (which was set to read resistance) to it.
(MULTIMETER RERESENTED BY OHMETER SYMBOL SINCE ITS ACTING AS AN OHMETER IN THE DIAGRAM ABOVE)
- I then put the thermistor in a beaker of water, along with a thermometer.
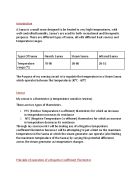
- By regulating the water temperature (increasing it through addition of hot water at 80°C and decreasing it by adding cold water or letting it cool) I collected the readings of resistance of the thermistor off the multimeter at 30°C and 60°C three times each and found the average
- I then suggested using a fixed resistor value within the range 160.7Ω to 394.0Ω as a resistor within that range is most likely to give largest variation in potential difference across the thermistor. The only value within that range on my resistor box is 220Ω so was my suggested value for my fixed resistor.
- In order to be certain that the resistor value I chose was the best possible one I picked the resistor values above and below it on the resistor box (470Ω and 100Ω) and decided to calculate the variation in the potential difference across the thermistor between 30°C and 60°C when connected in series with all three fixed resistor values 100Ω, 220Ω and 470Ω.
-
Using my supply voltage (Vin) as 5V my mean resistor values(R1) for the thermistor at 30°C and 60° fixed resistor values (R2) of 100Ω, 220Ω and 470Ω. I calculated the potential difference across my fixed resistor at 30°C and 60°C using the formula
Vout = R2____ × Vin
R1 + R2
Results are shown in the table below
As the largest change in potential difference across the thermistor was 1.097V which occurred when using the 220 Ω as the fixed resistor value I was able to conclude that 220 Ω is the best resistor value to use on my resistor box.
Measurements made
My objective at this point was to collect as accurate readings as possible for the potential difference across the thermistor in circuit at specific temperatures between 30°C and 60°C.
- Before starting I checked my voltmeter (multimeter) for zero error by measuring the potential difference across the no component and I checked my thermometer for zero error by putting it in melting ice.
- I then started by setting up the circuit above and placed my thermistor in a beaker with a thermometer.
- I boiled hot water and added it to the beaker
First problem I faced was collecting accurate temperature readings with the thermometer. I had to try to avoid parallax error and systematic error so I do not end up linking a voltage out (potential difference across thermistor) with a wrong temperature.
Improvement: I decided to use a data logger to replace the thermometer because it is more sensitive and also helps me avoid the problem of parallax error when taking readings.
- Before using the data logger put it in melting ice to check for zero error
- I then took my readings for voltage out at 60°C, 58°C, 56°C, 34°C, 32°C and 30°C (varying the water temperature by adding hot water to increase it and adding cold water to or letting it loose heat to the environment to decrease it). The readings are shown in the table below.
More Problems and improvements
-
Problem: Taking voltmeter readings was very hard as the reading on the voltmeter was hardly stable at high temperatures. I assumed this was due to the high rate of heat loss from the water causing the temperature of the water to drop quickly, thereby changing the resistance of the thermistor and thus affecting output voltage.
Improvement : I put an insulator round the beaker, and increased the volume of water I was using for each temperature reading as an attempt to reduce the rate of heat loss, thereby reducing the rate at which temperature drops and enable me take more accurate readings of the voltage out at high and low temperatures
-
Problem: I decided to use two data loggers as an improvement in taking temperature readings, keeping them at opposite sides of the beaker. I noticed that there was a variation of 0.2°C to 0.3°C in their temperature readings
Improvement: I decided to stir the water in an attempt to keep the water body at a uniform temperature. I also decided to cello tape a data logger to the right and to the left of the thermistor only taking voltage readings when they are both on the specified temperature.
New readings taken with improvements
The new readings are more consistent than the previous ones
I could now take all my readings of voltage out (potential difference across the thermistor) for every 2°C from 30°C to 60°C.
This I did and repeated 9 times and found the average
The readings were taken over three consecutive days using the same equipment throughout the experiment.
Safety Precautions in Carrying Out Experiment
- Had to be careful with hot water, wore gloves to reduce chances of getting burnt
- Avoided spilling water with lots of wires and electrical appliances around. (If water spilled switched of all appliances and cleaned it up with a cloth before proceeding on collecting readings)
- Careful use of scissors (sharp object) to reduce chances of getting a cut and kept the scissors away from wires and other electrical appliances.
- Avoided the use of any faulty or damaged instrument and use of wet hands on electrical appliances to reduce risk of electric shock.
- Kept all glassware (beakers and thermometer) towards the centre of the table and handled them with caution.
Table of Readings
Graph Description
The graph of V/V against T/°C shows a linear relationship between voltage out and temperature. The slope has a negative gradient showing that an increase in temperature causes a decrease in output voltage across the thermistor.
The line of best fit (L1) drawn has a gradient of -0.0295V/°C
Two other lines are present on the graph the first being A line (L2) showing the maximum possible gradient of (-0.0260 V/°C)
The second is a line (L2) showing the minimum possible gradient (–0.0330 V/°C)
Uncertainties in measurements
- Smallest division 0.1°C
- Uncertainty = ±(0.5 × 0.1) = ±0.05°C
-
Percentage Uncertainty in measurement = 0.05 ×100
30
=0.17%
=0.2% (rounding up)
- Smallest division 0.01V
- Uncertainty = ±(0.5 ×0.01) = ±0.005V
-
Percentage uncertainty in measurement= 0.005
1.56
=0.32%
=0.4% (rounding up)
- Largest Uncertainty is in Voltmeter readings
- Overall uncertainty = 0.4% + 0.2%+safety factor
= 2%
(The overall uncertainty is shown on the graph and also used in finding minimum and maximum possible gradients (sensitivity
- The small percentage uncertainty in my measurements shows why my results have small variations in output which is because the equipments I used have a high degree of accuracy. The equipments I work with is thus what limits my ability to make the uncertainty any smaller.
Systematic Bias in my Circuit : Systematic bias are constant offsets from true results. The power supply unit in my circuit has an internal resistance. This reduced all my voltage readings by the same amount causing a systematic bias in my results.
Systematic drifts: These are errors which change during an experiment making measurements show trends with time rather than varying randomly about a . My fixed resistor or power supply unit could have warmed up with time during the experiment causing their resistances to also rise with time, leading to systematic drifts. By turning off the power supply unit after collecting a set of readings and checking for zero error in my voltmeter and datalogger at the start and during my experiments, I reduced the chances of systematic drifts occurring.
Random Fluctuations: By repeating my experiment 9 times and finding averages using the same equipment, I reduced the effect of random errors on my results.
Response time : I used a sensitive thermistor in order to increase the response time of my sensing circuit as a short response time is required in Sauna’s to prevent temperatures from getting too high causing scalds and burns for its users.
Sensitivity : This is the ratio of change in output to change in input
from graph
Sensitivity (S) = change in output
change in input
-S = 2.44-1.85 = -0.0295V/°C
50-30
(Max Sensitivity=0.0330V/°C and Minimum sensitivity=0.0260 V/°C)
Uncertainty in sensitivity = 0.030 - 0.026 = 0.004 V/°C
Resolution : This is the smallest change a sensor can detect in the quantity it is measuring. The resolution is limited by the number of decimal places the voltmeter can display/ smallest reading the voltmeter can make (which for me was 0.01V)
0.03V= 1°C
0.01V= resolution
Sensitivity
= 0.01
0.030
= 0.333°C
Lowest Possible Resolution = 0.01 =0.385°C
0.026
- Uncertainty in resolution = 0.385-0.333= 0.052°C
=0.06°C (1 d.p)
Resolution = 0.33 ± 0.06°C
Conclusion
- My sensor system has small variations between repeated results with a largest voltage out variation of 0.4V and a smallest variation of 0.1V.
- My sensor system has a short response time for its application purpose.
- My sensor system has an appropriate output for a given input (0.030V/°C).
- My sensor system has a reasonably high resolution of 0.33°C based on its application purpose (temperature regulation in a Sauna)
All these are qualities of a good sensor system and since they’re all present in my sensor system I’ll conclude that my sensor system in fit for purpose.