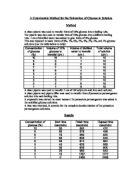
The next task was to calculate how much distilled water and how much sucrose solution was to be placed in each tube.
Sufficient distilled water and equivalent sucrose solution was measured and added to each test-tube in turn in the following quantities.
Next, the root samples were prepared. Using the cork borer, 6 samples were extracted from a potato. The diameter were all the same (this was ensured by using the same borer on all extractions) and all samples were measured to a precise 47mm. this length was used as it was the length of the shortest sample and so it was used in order to maintain consistency.
Filter paper was then placed on the weighing scales, and each sample was weighed in turn to determine its exact mass (correct to 0.001grams) so that once the experiment has been completed, a percentage mass gain or mass loss could be calculated.
Each sample was then dropped into each test-tube and was left for 55 minutes.
To eliminate differentiating factors, the weighing scales were reset to zero after the filter paper was placed on it, and all samples were of exact length and diameter. Sample mass did differ at the start of the experiment but this was no cause for concern as the aim of the experiment was to establish percentage change in mass, not actual change in mass.
The mass of each sample is shown in the table opposite. As expected, their were slight anomalies between samples. Although all attempts were made to ensure the regularity in size and shape, actual mass still differed but not to such an extent that the experiment had become unreliable. When extracting the samples from the potato, all samples had completely filled the cork borer in an attempt to ensure that a regular circumference was present for the whole 47mm of each sample.
Each sample was placed into its marked test-tube, at 15 second intervals. This was so that when the samples were removed from solution, they will all have been in solution for exactly the same time. The samples were left to soak for 55 minutes before they were removed. The time the samples were left to soak was irrelevant but it had to be at least 30 minutes to give each sample the opportunity to absorb or not absorb the solution in which is was in.
Results
After 55 minutes, the samples were removed from solution in the same order in which they were put in. The excess solution was shaken off each sample and then each sample was weighed and the results noted.
These results show the start, end and percentage change in mass in grams of each potato tuber.
Conclusions
The key word is osmosis. In Cambridge Advanced Science – Biology 1 osmosis is defined as: “the net movement of water molecules from a region of high water potential to a region of low water potential, through a partially permeable membrane, as a result of their random movement.” In plant cells, water, or a solution where water is the solvent, has a higher water potential than that of the plant cell (in this case, potato cells). Therefore, water will enter the cells through the partially permeable plasma membrane by osmosis.
This explains why the greater the concentration of the sucrose solution, the more mass each sample loses, and why the closer each solution comes to pure water, the less mass it loses and in one instance, the mass it gains.
As we know, water moves down the concentration gradient, not up. So if the tuber has gained mass, we can deduce that the solution has a higher water potential than the tuber. However, if the sample loses mass, we can deduce that the tuber has a greater water potential than the solution. The latter is clear for the 1.0, 0.8, 0.6 and 0.4 MOLAR concentrates and the former is true for the sample bathed in distilled water. However, I believe that the tuber bathed in the 0.2 MOLAR solution is closest to the tuber’s natural potential. I say this because the start mass was 1.53gram and the end mass was 1.52grams – a loss in mass of just 0.01grams. This means that after soaking in solution for 55 minutes, hardly any molecules were exchanged across the tuber’s membrane, at least not enough to change the tuber’s mass by more then 0.7%.
A Colorimetric Method for the Estimation of Glucose (or reducing sugars) in Solution.
Glucose, a reducing agent, will reduce an acidified purple-pink solution of potassium manganate (VII) solution to a colourless solution of manganese (II) ions. The partial ionic equation for this is
MnO4ֿ + 8H + 5eֿ ➔ Mn² + 4H2O
The time taken for the loss of colour from a standardised solution of permanganate is directly related to the concentration of glucose present in the solution
Apparatus
- 27.5ml solution containing 10g of glucose dissolved in 100ml water
- 3 x 5ml syringes
- 10 test tubes
- 25ml 1MOLAR sulphuric acid
- 10ml 0.01MOLAR potassium manganate (VII) solution
- 22.5ml distilled water
- Stop-watch
- Labels
Method
Each of the 10 test-tubes were lined up and had 2.5ml of sulphuric acid placed inside. Then, in the first tube, a 10% glucose solution was introduced to mix with the sulphuric acid. 1ml of potassium manganate (VII) was drawn into a syringe with the stop-watch started the moment this addition was made to the tube. The test-tube was given a brief shake so that all aspects of the experiment were mixed together. The object of this experiment was to find the time it took varying concentrations of glucose solutions to make the purple-pink potassium manganate (VII) solution clear.
In order to maintain continuity throughout the experiment, I decided to wait until the solution had totally cleared and had the appearance of clean water.
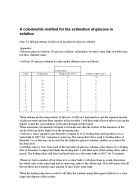
In the remaining 9 test-tubes, reduced concentrations of glucose solution were added to the sulphuric acid – 2.5ml of sulphuric acid is a constant factor throughout the experiment.
The concentration was reduced by 1% for each subsequent tube beginning with 9% reducing to 8% and 7% and so on down to a 1% glucose solution.
This was achieved by putting less of the 10% glucose solution and more distilled water as the concentration requirements continued to drop. The following table shows how this was achieved.
As this table shows, the exact measuring of each fluid was a painstaking process.
As the graph and table below shows, it took over 2 minutes for the initial test-tube to totally clear and so this gave me the opportunity to begin setting up the remainder of the test-tubes.
Once the solution has totally cleared, a note was made – in seconds – of the time it had taken. As for the first tube, each of the subsequent tubes had potassium manganate (VII) added and a stop-watch started once the addition was complete. Again, each test-tube was given a brief shake so all aspects could mix together and once the mixture had totally cleared, a note was made – again in seconds – of the time it had taken.
To fulfil the object of this experiment, we had been given 2 “unmarked” glucose solutions, which were to be tested. We would be able to see just how much glucose by seeing on the graph that we have drawn where the time meets the concentration level of glucose.
To do this, we set up the experiment in the same way that I did the previous 10 experiments. The solution was added to 2.5ml of sulphuric acid and then 1ml of potassium manganate (VII) solution. The mix was shaken thoroughly in the same way as the previous experiments. Again, the stopwatch was started once the potassium manganate (VII) solution came into contact with the acidified glucose solution and was stopped once the whole solution became as clear as water.
Results
The theoretical outcome of this was that as the glucose concentration fell, the time it took for the solution to clear should take longer. This theory was mirrored in the results obtained throughout the experiment.
As can be seen from these results, there was one anomaly. For the 10% solution, the mixture was not shaken, merely swilled around the test-tube. For all the subsequent test-tubes, the mixture was shaken to ensure all aspects of the solution were mixed thoroughly. This goes some way in explaining why the first experiment was some 16 seconds slower in clearing then the second and then the subsequent test-tubes got progressively slower, as expected.
At first glance, it would appear that this was the only anomaly. However, due to time restraints, a 25 minute time limit was placed on the experiment. The test-tube with the 1% glucose solution present had still not cleared after this time had elapsed and so 25 minutes (or 1500 seconds) was noted as it’s time.
Having measured the timings of the first 10 experiments, we should look at the results of the “blind testings”.
As they were “blind testings”, we could not draw any conclusions prior to the results so it was very much a case of “suck-it-and-see”.
As with the original testings, a 25 minute time limit was placed on the experiments. Test tube B, like the 1% solution had still not cleared when this time had elapsed and so again, 1500 seconds was noted as it’s time.
Conclusions
Having identified the anomalies, we can now analyse these results. As stated, the original experiment’s results were as expected. Although we could never predict the timings, it was reasonable to expect the solutions to take progressively longer to clear.
I believe that placing a 25 minute time limit was a reasonable action. Even though neither of the weak solutions – 1% glucose solution and “SAMPLE B” – became fully clear, I am confident that both solutions were at the same stage. I feel that once the time limit had elapsed, both solutions were a transparent, light brown-green colour.
By looking at the graph, I can draw no other conclusion in regards to SAMPLE B than to assume that at most, there was no more than 1ml of glucose and 99ml of distilled water in a 100ml solution. That is to say, SAMPLE B was at most a 1% glucose solution.
SAMPLE A is much easier to estimate. We can see from the original experiments that 9% had a time of 126 seconds and that the 8% solution had a time of 149 seconds. By looking at the graph, we can see that SAMPLE A has a glucose concentration of around 8½%. That is to say 8.5ml of glucose and 91.5ml of distilled water in a 100ml solution.