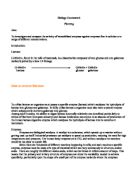
Preliminary Work
As preliminary work a “trial experiment” will be set up where a number of variables are kept constant apart from temperature. The enzyme used for the experiment will be lactase, used to breakdown the substrate lactose to form the monosaccharides glucose and galactose. The amount of glucose produced will be measured with the use of Benedict’s solution and then the colorimeter to gain a quantitative result. These results will indicate when a reaction is still taking place and whether or not the enzyme is still working whereby lactose is still being broken down by the lactase.
The trial experiment will help me to determine the range of temperatures that need to be used in the final experiment. Factors of the trial that go right or wrong will also be used to determine changes and alterations in the final experiment as well as methods that work well that should be kept the same. The trial investigation will be carried out as accurately as possible; flaws discovered will be recorded and solved before the actual investigation. This shows development and amounts to additional knowledge in understanding enzyme activity and denaturation in relation to thermodynamics.
Key Variables
- Amount and concentration of enzyme (lactase)
- Amount and concentration of substrate (lactose)
- pH
- Temperature
As these variables all affect rate of reaction, all must be kept constant, with temperature being the only changing variable. In doing so it is ensured that results show only the affect of temperature. The temperature should measure accurately according to the range of temperatures pre-determined by the trial experiment.
Preliminary Experiment 1
Materials
-
2cm3 Lactase, e.g. Novo Nordisk Lactozym
-
8cm3 of 2% sodium alginate solution, made up in distilled water.
-
100cm3 of 2% calcium chloride solution in a plastic beaker
- Glucose strips, Diabur 5000
- Nylon gauze
-
10cm3 plastic syringe & barrel
- Clamp stand
- Short length of tubing to fit plastic syringe and screw clip
-
100cm3 beaker
- Glass rod
- Distilled water
- Pasteurised milk
- Plastic Tea Strainer
- 6 Test Tubes
- Stop Clock
Method
Mix the sodium alginate solution with the enzyme solution in a beaker, and then transfer to a plastic syringe. Add this mixture drop-wise to the calcium chloride solution. Alginate beads, containing the enzyme, will form immediately. Leave to harden for a few minutes then strain off the beads using a tea strainer and rinse with distilled water. Put a piece of nylon gauze in a 10cm3 syringe barrel to prevent the beads becoming stuck to the outlet, then add the beads to the syringe. Hold the syringe using a retort stand. Close the screw clip, then fill the syringe with milk that has been heated to the required temperature. Open the clip slightly then, after 5 minutes take a sample of the products and place in a test tube. Test for the presence of glucose with the use of glucose strips. Record all results.
Results
Analysis
Although results where qualitative and not quantitative there was an obvious trend in the amount of glucose present at the different temperatures in which the enzymes had to work. The optimum temperature, according to the glucose strip scale, was between 30°C and 40°C. As the temperature increased after 40°C the amount of glucose produced began to decline until at 70°C there was no change. No change indicates that by this time the enzyme had completely denatured and was no longer able to break down the lactose.
Conclusion
The results from the experiment matched the hypothesis. Following the optimum temperature glucose production began to decrease until the point where it stopped altogether due to denaturation of the lactase enzyme.
Evaluation
Overall the experiment worked well, with a good range of temperatures that displayed results that were highly desirable with a clear trend that lead to an appropriate conclusion. However, several areas with room for improvement were found during the practical.
Firstly, heating the milk proved difficult when trying to reach the correct temperature. To improve this next time a good idea would be to heat with the Bunsen burner hole half open so the milk is heated at a slower pace and the temperature can be more accurately monitored. I also found that when heating is stopped the temperature of the milk continues to rise by 5°C. Therefore, when trying to reach a desired temperature the heating of the milk should be stopped once the milk has reached a temperature of 5°C below that of which is trying to be reached. For example, when heating the milk to 40°C, turn off the Bunsen burner once the milk has been heated to 35°C. This will help improve the fairness and accuracy of the test.
The accuracy of the experiment can be further improved by measuring all liquids required in a measuring cylinder. The measurements of a measuring cylinder are more accurate than those of a beaker.
A vast improvement would be performing a Benedict’s test, which would enable me to obtain quantative results, rather than glucose strips, which do not.
Another problem encountered was the transferring of milk from the beaker to the syringe. It was found that this caused a reduction in temperature, therefore making the experiment inaccurate. Next time I will keep the milk in the beaker and simply add the immobilised enzymes whilst the milk is still at the desired temperature.
Preliminary Experiment 2
Materials
-
2cm3 Lactase, e.g. Novo Nordisk Lactozym
-
8cm3 of 2% sodium alginate solution, made up in distilled water.
-
100cm3 of 2% calcium chloride solution in a plastic beaker
- Glucose strips, Diabur 5000
-
100cm3 beaker (to heat milk)
- Glass rod
- Distilled water
- Pasteurised milk
- Boiling water bath (to carry out Benedict’s Test)
- 6 Test Tubes
- Plastic Tea strainer
Method
Mix the sodium alginate solution with the enzyme solution in a beaker, and then transfer to a plastic syringe. Add this mixture drop-wise to the calcium chloride solution. Alginate beads, containing the enzyme, will form immediately. Leave to harden for a few minutes then strain off the beads using a tea strainer and rinse with distilled water.
Heat the lactase in a beaker to 5°C below the desired temperature using a half-open hole on the Bunsen burner. Once this temperature is reached turn off the Bunsen burner and add the immobilised enzymes to the beaker once the milk has reached the desired temperature.
After the enzymes have been in the beaker with the milk for 5 minutes take a measured sample of milk from the beaker using a pipette. Place one sample of milk for each temperature in a test tube; add a few drops of Benedict’s Solution and heat in boiling water bath for three minutes. Then place each sample in the colorimeter and record results.
Results
Analysis
Results showed absolutely no trends, neither quantative or qualitative. This is due to the galactose, which is also a monomer of disaccharide lactose, along with the monosaccharide glucose. Although the Benedict’s test is used to test for the presence of glucose it did not work (even though glucose was present) due to the presence of galactose. Galactose affected the results because it is not a reducing sugar; therefore the Benedict’s test did not work and simply resulted in a thick yellow precipitate that transmitted no light. Although the shade of yellow varied depending on the amount of glucose present the change in shade of yellow was extremely subtle and could not be picked up by the colorimeter anyhow because it was a precipitate that absorbed all the light.
Conclusion
No links could be established between the hypothesis and the results because due to the presence of the non-reducing sugar, galactose, the Benedict’s test did not work. Therefore, each sample, after testing with Benedict’s solution, produced a thick creamy-yellow precipitate each measuring 0% transmission and 2 absorbance on the colorimeter as no light could get through. No results in this experiment could be used as part of this investigation other than for the purpose of learning from mistakes.
Evaluation
The enzymes used in this experiment were slightly soft. To prevent this in the next experiment the enzyme solution must be mixed thoroughly before being added to the calcium chloride solution for immobilisation.
The accuracy and fairness of the experiment could be improved by wrapping bubble wrap around the beaker once the milk reaches the required temperature and the bunsen burner has been turned off. This insulation will help maintain the milks temperature for a longer period of time before cooling down, ensuring it does not decrease whilst the experiment is still taking place.
The fairness of the experiment could also be improved by ensuring immobilised beads are roughly the same size by measuring the drops e.g. 2ml of enzyme solution added to the calcium chloride solution. This will help keep the surface area of the enzyme variable constant for a fairer test.
As the Benedict’s test did not work no quantative results were gained. In an experiment such as this I believe the most quantative results possible will only be gained with the use of glucose strips. In my final experiment I will record the number of crosses (which relate to the amount of glucose present), in accordance with the glucose strip scale, per sample and shall test at 5 samples per temperature at 1-minute intervals up to 5 minutes. I shall plot a graph of results and observe any trends.
Due to the expense of the Diabur 5000 Glucose Strips and as I am taking results at greater intervals I shall reduce the number of temperatures investigated to 40°C, 60°C, and 80°C. I shall also repeat the experiment at least three times and calculate an average from the range of results taken to ensure that anomalous results do not affect my conclusion.
Implementation
Final Experiment
Apparatus
-
2cm3 Lactase, e.g. Novo Nordisk Lactozym
-
8cm3 of 2% sodium alginate solution, made up in distilled water.
-
100cm3 of 2% calcium chloride solution in a plastic beaker
- Glucose strips, Diabur 5000
- Nylon gauze
-
10cm3 plastic syringe & barrel
- Clamp stand
- Short length of tubing to fit plastic syringe and screw clip
-
100cm3 beaker
- Glass rod
- Distilled water
- Pasteurised milk
- Plastic Tea Strainer
- 6 Test Tubes
- Stop Clock
- Bubble wrap (to wrap around beaker for insulation)
Method
Mix the sodium alginate solution with the enzyme solution in a beaker, and then transfer to a plastic syringe. Add this mixture drop-wise (approximately 2ml per drop) to the calcium chloride solution. Alginate beads, containing the enzyme, will form immediately. Leave to harden for a few minutes then strain off the beads using a tea strainer and rinse with distilled water.
Heat the lactase in a beaker to 5°C below the desired temperature using a half-open hole on the Bunsen burner. Once this temperature is reached turn off the Bunsen burner and wrap the beaker in bubble wrap. Add the immobilised enzymes to the beaker once the milk has reached the desired temperature.
After the enzymes have been in the beaker with the milk for 1-minute take a measured sample of milk from the beaker using a pipette. Place the sample of milk in a test tube and test for glucose using a Diabur 5000 Glucose strip. Record the results by number of crosses on the glucose strip scale according to how much glucose is present. Do the same (take a sample of milk, place in a test tube, and test for glucose with a glucose strip) every minute for 5 minutes for each temperature. Record the results as before.
Repeat the experiment at least 3 times to gain repeat results that can be used to gain an accurate average.
Results Graphs
Analysis
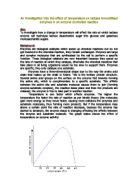
Results for my final experiment were extremely useful and displayed highly relevant trends between temperature and enzyme activity. The average result for 1 minute of reaction at 40°C was negative on the glucose scale indicating no glucose present. Most people would think that because the optimum temperature of lactase is between 40°C-45°C that such a reading at 40°C would be wrong. However, when thinking about it scientifically, the enzyme used was immobilised, enclosed in a matrix, therefore requiring more time for heat to reach the enzyme. Hence the logical result that at 1 minute the lactase enzyme must not yet have reached the 40°C temperature of the milk resulting glucose production that was not yet detectable on the glucose scale. However, from 2 minutes onwards the amount of glucose present was increased steadily.
At 60°C the amount of glucose increased steadily from ‘+’ on the scale at 1 minute to ‘+++’ at 5 minutes. This may be surprising at first considering that enzymes start to denature as soon as the temperature goes over that of the optimum, and the optimum temperature of lactase is 40°C-45°C. However, once again due to the matrix surrounding the enzyme heat takes longer to affect the lactase, so when immobilised, the enzyme is still active within 5 minutes of 60°C. So once again, when analysing results they are found to be logical.
On average, at 80°C tests for glucose were negative. This was expected because by this time the heat has reached the lactase enzyme and its active site has been denatured resulting in no break down of lactose. The temperature at which denaturing occurs is higher due to the enzyme being immobilised as predicted in the hypothesis.
The only anomalous results gained were those of the third repeat experiment where the amount of glucose measures the maximum ‘+++’ on the Diabur 5000 glucose scale throughout the 5 minutes tested. These results were anomolous because the previous two experiments performed at 80°C displayed no signs of catalytic activity due to no present glucose. The most likely explanation for the anomalous results is that the milk had not been fully heated to 80°C before the enzyme was added, or it had and the temperature had dropped before the enzyme was added. Due to this the enzyme may not have denatured straight away at this temperature resulting in the splitting of lactose, therefore resulting in the detection of glucose. Even if the temperature was high enough to denature the lactase after 1 minute, minimum, (remember, denaturation is time-dependant), the glucose that had been formed from that 1 minute would still be detected in the other samples from then on as it is still formed and present even after denaturing occurs. This is probably along the liens of what occurred to cause the anomalous set of results. Despite this the average was not affected due to the accurate results of the other repeats.
The graphs drawn using the average results showed significant trends between temperature and the production of glucose by the breakdown of lactose. The smaller graphs for each time interval displayed the amount of glucose present for each temperature at that precise time. The main graph, however, shows trends more clearly. The gradient for the reaction at 40°C is not as steep as that of 60°C. This indicates that there was a faster rate of reaction resulting in faster production of glucose (breakdown of lactose) at 60°C than at 40°C. However, the gradient of the reaction at 80°C is non-existent because the average results at this temperature were all negative. Therefore it can be settled that the graphs clearly display the trends set by the results as explained previously in more detail.
Overall, the results matched my hypothesis that denaturing of lactase occurs at a higher temperature when immobilised than that of when un-immobilised (40°C-45°C). This is obvious from my results because catalytic activity was still taking place at 60°C with glucose still being formed. This is due to the matrix surrounding the enzyme, which acts as a temporary barrier therefore taking heat longer to reached the enzyme and take effect.
Conclusion
Temperature has a major effect on the denaturing of the enzyme lactase. I am able to draw this conclusion because I believe my results to be an outcome of a fair an accurate investigation.
Although there was one set of anomalous results these had a logical explanation and did not affect the overall average results because there were, in total, three repeat results established from the experiments. These repeats ensured the test was accurate so that any mistakes would be accounted for as in the anomalies.
Apart from this, all results were extremely consistent displaying obvious trends that the higher the temperature the faster the lactose was split and glucose produced. Results indicated that the optimum temperature was somewhere between 60°C and 80°C. This, despite the optimum temperature of lactase being 40°C-45°C, is understandable because I was investigating immobilised lactase which takes longer to be reached and effected by heat.
This conclusion supports the scientific theory of temperature affecting the collision theory of enzymes in reaction. The higher the temperature the greater kinetic energy given to the enzyme and substrate molecules. This leads to an increase in the collisions between the enzyme and substrate molecules creating a higher probability of the formation of enzyme-substrate complexes. Due to this the rate of reaction is increased and more glucose is formed within a shorter period of time. This occurs up until the lactase enzyme is denatured where the active site of the enzyme molecule is altered and can no longer achieve any catalytic activity. The conclusion also supports my hypothesis, which was also based on scientific background knowledge.
Evaluation
On the whole, the experiment was successful. It was carried out under safe conditions and the preliminary experiment helped me to determine areas in need of improvement from the start. Therefore, by the time I reached my final experiment I was able to make it a fair and accurate test and collect suitable results that formed a firm conclusion and also matched my hypothesis.
To ensure this I carried out numerous procedures throughout, as follows:
- Health and safety procedures were followed closely to ensure that the working environment was not a risk to health or safety
- Measuring any liquid substances in a measuring cylinder rather than a beaker to gain more accurate measurements
- Ensuring the same amount and concentration of enzyme (lactase) was used each time in order to keep this variable constant throughout
- Ensuring the same amount and concentration of substrate (pasteurised milk/lactose) was used each time in order to keep this variable constant throughout
-
Heating the milk to 5°C below the required temperature because it was found that when the Bunsen burner was turned off the temperature of the heat continued to rise by 5°C
- Heating the milk using a half-open Bunsen hole for more gentle heat therefore making it easier to regulate the temperature of the milk
- Mixing the enzyme solution thoroughly before adding it drop-wise to the calcium chloride solution to prevent the production of soft/“mushy” enzymes that are not properly immobilised
- Wrapping bubble wrap around the beaker to act as an insulator once the milk reached the required temperature to help regulate the temperature variable
- Ensuring the immobilised beads are roughly the same size by measuring the drops e.g.2ml of enzyme solution added to the calcium chloride solution to ensure that the surface area of the immobilised enzyme does not take a bearing on the results of the experiment as it is not part of the investigation and should be kept as constant as possible
- Carrying out repeat experiments for accuracy, helping to detect any anomalous results and to be able to create a more accurate average
-
Placing samples of milk in a test tube first and then testing for glucose. This created a more accurate test because glucose strips have to be held in the product for 10 seconds, so by transferring the product to a test tube the exact product for the exact time being tested can be checked for glucose.
I could improve the investigation by keeping closer checks on the variables being kept constant, especially pH, as this was not really taken into account. This could be done with the use of universal indicator paper or litmus paper, which could be used to check the pH of the milk after heating right before the enzyme is added. For a fair test the pH would have to remain the same (constant) every time.
It may also be a good idea to increase the number of temperatures tested to get an even more precise idea of what the actual optimum temperature of immobilised lactase is and when it denatures rather than stating a large range within which the optimum falls. A more suitable range would be between 5°C.
Another improvement would be to investigate un-immobilised lactase as well as immobilised lactase so that the results can be compared rather than simply relying on scientific background theories and predictions. This would expand the investigation as well as produce results that could be used to back up so much scientific knowledge therefore broadening understanding of the denaturing of lactase in relation to the law of thermodynamics.
The greatest improvement, however, would be making the results more quantitative to an even greater degree. This was attempted by the use of a Benedict’s test for glucose. This did not work, however, due to the presence of the non-reducing sugar, galactose. However, this could, in future investigation, be used to an advantage. Rather than test for the formation of glucose on the splitting of lactose I could test for the non-reducing sugar galactose. By performing a non-reducing sugar test. Firstly, a Benedict’s test would need to be performed on the sample. The Benedict’s test would be negative due to the non-reducing sugar, so then the sample would be hydrolysed by heating with hydrochloric acid, then neutralised with sodium hydrogen carbonate. This breaks the glycosidic bonds present. Then a second Benedict’s test would be performed, which will be positive because the monomers are now free.
Despite these improvements, I believe I carried out this investigation to the best of my ability especially considering the limitations. The limitations I faced included limited time, the expense of the Diabur 5000 glucose strips, and the amount of lactase enzyme available. All of these confined my investigation in some way resulting in the investigation not being carried out to its full potential. In spite of this the results that I was able to gain were very successful.
Results Graphs
The following are small and simple graphs to show the general trend in how temperature affects the amount of glucose present through a range of 1-minute to 5-minute reactions:
Results after 1-minute time interval
Results after 2-minute time interval
Results after 3-minute time interval
Results after 4-minute time interval
Results after 5-minute time interval
The following is a more complex graph displaying all the results obtained from the investigation.
The graph shows the effect of temperature on the amount of glucose
produced within 1-minute time intervals for 5-minutes.
Results
(Neg. = Negative result [no change on glucose strip])
Average Results