The ways in which H2O2 is produced in potatoes and humans is the same; as are the ways Catalase is produced and applied. Therefore this experiment could be applied to human biochemistry. However, using natural materials does pose some problem to the accuracy of results. When materials that are produced naturally are used the results rarely match up exactly. In a potato, for instance, as the plant grows, so does the tuber. In a natural environment the conditions that the plant encounters change day by day, causing the processes inside the cells to change to suit the factors. When the tuber was taken the cells would not have been at exactly the same stage in all processes. This means that in each sample of potato their will be different amounts of Catalase. There may also be other chemicals which affect the reaction.
- How do the substrate and enzyme meet?
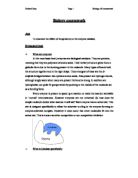
In normal reactions, the rate is determined by how fast and often the particles involved collide. However, when enzymes are involved the substrate has to collide with the correct speed and orientation. This last part is crucial. As we have discussed, the enzyme is made with an active site that exactly complements the shape of the substrate. Therefore if the substrate collides at any other angle than the one that the enzyme is expecting it will be rejected like any other chemical.
Below is a diagram of the lock and key model of the substrate enzyme complex. It is a formation reaction that is catalysed by an enzyme, whereas the reaction in this practical is a division reaction however the process is the same.
Prediction
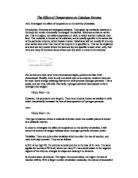
It is expected that as the temperature increases from 0ºC the reaction will speed up, until the protein starts to disnature. It is anticipated that the enzyme will be fully denatured at around 45ºC. As the enzyme is also found in humans, I expect also that the optimum temperature to be at around 37ºC, as that is the optimum temperature of humans. At 0°C I expect that although there will be a reaction as the protein is not dead, it will be extremely slow.
Below is a sketch graph of the predicted results.
Variables
- Independent variables: temperature
- Dependent variable: volume of gas collected time
-
Controlled variable: pH, , concentration of enzyme, strength of H2O2 Temperature
The only factor that will be changed is the temperature. The pH, pressure and time allowed for each experiment will remain the same throughout.
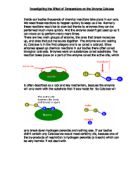
For the experiments at 0°C, the reactants were placed in the freezer until they reached the desired temperature. For temperatures above 0°C but below room temperature (20°C) the reactants were placed in test tubes in a water bath cooled with ice to the desired temperature. Reactions above room temperature were heated by placing the reactants and a third empty boiling tube in a water bath heated by a Bunsen burner. When the substrate and enzyme had both reached the correct temperature they were poured into the pre-warmed test tube. This avoided a sudden loss of heat as they would have done when they touched a cold boiling tube.
To determine the temperature a mercury thermometer was placed in the water and when the water was at the right temperature the flame was removed or ice taken out. To maintain the temperature heat was reapplied as and when necessary. Although a digital thermometer may have been more accurate, for the purposes of this experiment a mercury thermometer was sufficient.
Preliminary Work
The experiments will be done from 0°C upwards. Two reactions at the same temperature occur concurrently but started 15 seconds apart so readings could be taken more easily. This saves time. If only one experiment was done for each temperature the results could be wildly inaccurate but this could go unnoticed. Therefore, a second experiment was done and if they disagree wildly then a third was done. However, unlike experiments with laboratory made chemicals; results with naturally occurring chemicals (such as enzymes made by complex organisms) are very unlikely to match closely.
No outside sources were used to develop the plan although the diagram (appendix 2) was drawn by another pupil.
Method
The experiments were run for two minutes only with readings taken every thirty seconds. Although pressure has an effect on the rate of reactions this was not directly controlled as the atmospheric pressure stayed fairly constant. The temperature was controlled using the methods stated above.
The range of temperatures started at 0°C and went to 40°C. Where there was spare time an experiment was done at 5°C intervals.
One experiment was done with MnO2. An experiment was done at each temperature substituting H2O2 with H2O.
In all the experiments 5ml was used of both the enzyme solution and the substrate. This was measured with a 20ml measuring cylinder with 1ml gradations. The hydrogen peroxide was provided at 50 vol and that was kept as the start concentration throughout. The enzyme came from a potato, which was weighed and then liquidised in a blender. This was then diluted to a ratio of 9:20 (potato to water). By liquidising the potato not only was the surface area increased exponentially but also many of the cell walls were ruptured allowing the catalase inside the cell to act on the hydrogen peroxide outside the cell.
There were alternatives to a burette. These were a gas syringe or a measuring cylinder. There were several advantages to a burette that the other options lack. The cross-sectional area of the burette is small. This means that small increases in volume make a large impression. After test experiments were done to gauge the approximate volume of gas that would be released in each experiment it was obvious that a large sized measuring cylinder would have to be used. However the area in these is very large and the scale is large. The laboratory had only one glass gas syringe. If this should have become broken or damaged there would not have been a replacement. Plastic gas syringes are not as accurate. This is because they are prone to sticking, when this happens, the pressure can build and the rubber tube can come off. This would result in a large loss of gas.
Before the reaction took place it was made sure that the burette was perpendicular to the ground (this ensured accurate reading of the meniscus in the burette) and that it was full of water. Also the delivery tube was placed inside the burette but below the first line on the burette. The reactants were then placed in separate boiling tubes and they and a third empty boiling tube were placed in the water bath to get them to the desired temperature. After five minutes at that temperature, first the potato was put into the third boiling tube and then as the H2O2 was poured in the bung was put in and the timer started. The boiling tube was then shaken vigorously for the two minute duration of the experiment. As the hydrogen peroxide decomposes, froth builds up on the top. However this could not be stopped; also produced is O2 bubbles. These rose to the top and went through the delivery tube into the top of the burette. This displaced the water. Every thirty seconds the number closest to the bottom of the meniscus of the water in the burette was recorded.
Apparatus & Materials
Water bath; burette; Bunsen burner & mat; retort stand & boss; boiling tube x 3; mercury thermometer; delivery tube & bung; 20ml measuring cylinder.
9:20 diluted potato solution; 50 vol H2O2; ice.
Risk assessment
Results
Average rate of reaction at 30 seconds
in cm3 of gas released per minute
(30 second reading x 2 to give rate per minute)
This was worked out by taking the 30 second average and multiplying by 2. This gave volume of gas released per minute for the peak speed (at t = 30) although the speed had already started to reduce by this point we didn’t have readings for any time before.
Conclusion
It can be concluded that the rate of reaction increases as the temperature increases until the catalase starts to denature at 25°C. This can be seen by the steady rise to 20°C before blooming and then falling within 10°C, reaching zero again at 45°`C.
The collision theory states that effective collisions between reactant molecules must occur in order for the reaction to occur. The initial reaction rate is the greatest because the proportion of substrate (changing) to enzyme (constant) is the highest. As the concentration of the substrate decreases, the likelihood of a substrate and enzyme colliding at or above the EA decreases by the second.
Interpretation
The results support my prediction in the general trend, although the particulars (rate of reaction at 0°C and optimum temperature) are inaccurate in the prediction. It was not expected that the optimum temperature should be so far from the rest of the line. Also it was predicted that the optimum temperature would be higher with the decline after the peak to be steeper.
One reason for these discrepancies could be that the prediction was based on human temperatures and what was learned about homeostasis in relation to enzymes. However, the data points to the fact that for enzymes that are found in all sorts of organisms, the optimum conditions might be at a place more suitable to both endo- and exothermic organisms.
The reason why the enzyme denatures is the bond energy of the sulphide bridges is very low. As such they can survive temperatures <40°C but at this temperature enough energy is being put into the molecule to break the bonds.
The trend can be seen in terms of the Boltzmann distribution curve in relation to the collision theory. All atoms are vibrating all the time at every temperature. All the molecules in the mixture have kinetic energy. The amount of kinetic energy is worked out by using the equation E= ½ mv2. In any particular mixture of moving molecules, the speed will vary a great deal, from very slow particles (low energy) to very fast particles (high energy). Most of the particles however will be moving at a speed very close to the average.
The Maxwell-Boltzmann distribution shows how the speeds (and hence the energies) of a mixture of moving particles varies at a particular temperature.
www-jcsu.jesus.cam.ac.uk/.../ kinetics/kinetics.html
There are several points to note on the graph:
- No molecules have zero energy
- Very few molecules have a high energy
- There is no maximum energy value
For the reaction to occur, the particles involved need a minimum amount of energy - the Activation energy (EA). If a particle is not in the shaded area, then it will not have the required energy so it will not be able to participate in the reaction. The graph clearly shows that at higher temperatures the number of molecules above the EA is greater, although still with a large proportion of molecules not reacting
Evaluation
Although there were some errors in the results, for instance the last point on the 0°C line, because natural ingredients were used, this was to be expected. This was also the reason why the two sets of results are often further that 1cm3 different yet not classed as erroneous. The variance can be seen by looking at the variance graphs at the back. These show that for nearly every reading, at all temperatures, the two results were very close to the average. Naturally produced ingredients are very hard to maintain a constant concentration due to the different cells receiving different amounts of nutrients etc. Because the stock came from different potatoes this difference was exaggerated. As they could have come from different farms and possibly even different countries.
As the ingredients were mixed it took some time before the cork could be put in place. As the rate of reaction is fastest at the very beginning, potentially a lot of oxygen would have been lost at this point. As the delay would not have been constant throughout all the experiments this discrepancy cannot be calculated. This is probably the most significant factor in error within the method as it isn’t in anyway controlled or accountable for.
Timings were taken every 30 seconds on each experiment. However as two experiments were taking place with only 15 seconds separation, in practice a reading was taken every 15 seconds. It was found to be quite hard to get the reading at exactly every 30 seconds. However all the readings were taken within 3 seconds of the mark. Therefore this is a small but still real cause of error in the results.
The volumes were chosen based on test experiments that were done before the results were taken. It was seen that a lot of gas was produced, and therefore only a little of the reactants were needed to fill the burette. However if burettes were available that had equally good resolution yet a bigger capacity (100cm3) then more reactants could be used. This would have given a much bigger margin of error.
The amount of lab time available for collecting the data was not very high. This meant that only two sets of results could be gained. Had there been more time and more data gained then the averages would have allowed more accurate results.
The results that were gained were accurate enough for the purposes of the coursework. The burette had a good level of sensitivity. However the flask containing the reaction could have been placed on a mass balance and connected to a computer which took readings over a similar time period. This would give data on the ‘loss’ of mass during the reaction. This loss would be the O2 gas being released during the reaction. This additional data would enhance the accuracy of the results that were obtained.
There were no significant anomalous results. This can be seen in the graph as all the points fall on the lines.
As can be seen on the graphs, for almost all the points the limit lines are very small. However, in the higher temperatures the 30 second points have larger limit lines. These could be diminished by more closely controlled data collecting
When a test was done with manganese dioxide, no results were taken because MnO2, being a chemical catalyst, made the reaction finish within seconds. As the data was being taken every 30 seconds, this was useless. Although there were some errors in the results, for instance the last point on the 0°C line, because natural ingredients were used, this was to be expected. This was also the reason why the two sets of results are often further that 1cm3 different yet not classed as erroneous.
The apparatus (shown in appendix A) was sufficient for this practical.. In this practical pure Catalase was not used but a potato solution had to be used. This potentially caused complications that polluted the results. This is probably the cause of the inaccuracies in the results. If the Catalase could be isolated then the results may be very different. It would be interesting to compare the results from that reaction and the reaction carried out here. From that one could see how other molecules interact with this process and to what end.
I think that despite a few problems with the materials the conclusion is a safe one to make with the data available.
An additional piece of apparatus could be added to supplement and enrich the data. If the experiment were done in a conical flask on a mass balance, the weight loss could be included in the data.
Although there were a few areas of inaccuracy the data are still valid. With the extra measures and checks and more time to collate more data the results would be much improved
http://www.seps.org/oracle/oracle.archive/Life_Science.Biochem/2001.07/000994160576.9934.html
http://www.blc.arizona.edu/marty/181/181Lectures/Figures/POHS_Figures/Chap6/Fig6_13.gif
For step-by-step instructions see appendix