To find out the effect of increasing the concentration of hydrogen peroxide on the rate of catalytic reaction using catalyse.
Investigation into the factors that affect the rate of reaction between Catalase and Hydrogen Peroxide
Aim
To find out the effect of increasing the concentration of hydrogen peroxide on the rate of catalytic reaction using catalyse.
Enzymes
Enzymes are proteins that act as catalysts. They are made in the cells. A catalyst is a chemical substance which speeds up a reaction but does not get used up during the reaction. One enzyme can be used many times over.
After the new substance has been formed, the enzyme is set free to start another reaction. Molecules of the two substances might have combined without the enzyme being present but they would have done so very slowly. By bringing the substances close together, the enzyme molecule makes the reaction take place much more rapidly. A chemical reaction which would take hours or days to happen on its own takes only a few seconds when the right enzyme is present.
Reactions which split large molecules into smaller ones are called catabolic reactions.
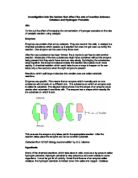
Enzymes are specific. This means that an enzyme which normally acts on one substance will not work on a different one. The substance on which an enzyme acts is called its substrate. The diagram below shows how the shape of an enzyme could decide what substrate it combines with. The enzyme has a shape which exactly fits the substrate on which it acts.
This ensures the enzyme only takes part in the appropriate reaction. After the reaction takes place the enzyme can act on another substrate.
Extracted from 'GCSE Biology second edition' by D.G. Macken.
Hypothesis
Some of the chemical reactions which take place in cells produce a by-product called hydrogen peroxide. Hydrogen peroxide is very poisonous and even deadly to some organisms. It must be got rid of quickly. Under the influence of an enzyme called catalase, the hydrogen peroxide is broken down into water and oxygen. Catalase works very quickly. It can deal with six million molecules of hydrogen peroxide in one minute.
The equation for this reaction is:
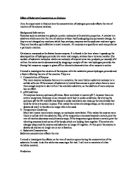
'If the concentration of substrate is increased, but the concentration of enzyme remains constant, the rate of reaction will increase as the substrate concentration increases, but only until all the enzyme molecules are being used. At this point all the enzyme molecules are at work. After this point, no matter how much more substrate is added, the enzymes are working as fast as they can, so the rate of reaction reaches a maximum velocity and remains constant. This rate is referred to as Vmax.
Graph to illustrate the effect of substrate concentration on the rate of reaction, showing that addition of substrate increases reaction rate until the enzyme is saturated, at which point the maximum rate of reaction is reached.'
Quoted from the A-Level study guide 'Molecules and Cells' by John Adds, Erica Larkcom and Ruth Miller.
From my scientific knowledge I predict that as the concentration of the hydrogen peroxide is increased, the reaction rate will increase until a point is reached where all the enzyme molecules are working on hydrogen peroxide molecules so the rate of reaction cannot increase further. This will be shown by a graph showing the effect of substrate concentration on rate of reaction with a decreasing gradient.
Apparatus
> Conical Flask
> Gas Syringe
> Bung
> Delivery Tube
> Stop Watch
> Scales
> Measuring Syringe
> Hydrogen Peroxide
> Yeast (containing catalase)
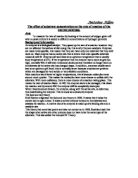
Diagram
Method
Connect a gas syringe, glass tube and conical flask as shown above. Keep the gas syringe up using a stand and boss head. Make sure there is no air in the gas syringe and that it is clean. If the gas syringe is not clean then it could be sticky and the measurements will not be accurate.
The gas syringe will be used to measure amount of oxygen released from the reaction:
Therefore measuring this will show the rate of reaction as oxygen is a product of the reaction. Five ranges of hydrogen peroxide concentration will be used. These are 100%, 80%, 60%, 40% and 20%. Using these ranges should be enough to produce a suitable conclusion.
Measure out 0.25g of yeast using the electronic scales. Put this in a conical flask. Measure out 10cm of Hydrogen peroxide solution using a measuring syringe. Put this in a small beaker.
Make sure all the equipment is very close by and ready for use. Make sure the stop clock has not started timing yet and is a 0. The bung must not yet be in the conical flask. The delivery tube must be in the bung. Quickly add the hydrogen peroxide to the conical flask and close the bung. At the same time start the stop clock. Measure the gas evolved every ten seconds. Shake the bottle gently during the experiment to make sure all the enzyme and hydrogen peroxide are used to their full potential. Do this for 80 seconds. Record the results.
After the 80 seconds is over, stop and reset the clock. Wash out the conical flask so there is no hydrogen peroxide or yeast in the flask. Measure out 0.25g of yeast using the electronic scales. Put this in a conical flask. Measure out 8cm of hydrogen peroxide solution using a measuring syringe. Put this in a small beaker. Measure out 2cm of distilled water and add this to the beaker to make an 80% hydrogen peroxide solution.
Make sure all the equipment is very close by and ready for use. Make sure the stop clock has not started timing yet and is a 0. The bung must not yet be in the conical flask. The delivery tube must be in the bung. Quickly add the hydrogen peroxide to the conical flask and close the bung. At the same time start the stop clock. Measure the gas evolved every ten seconds. Shake the bottle gently during the experiment to make sure all the enzyme and hydrogen peroxide are used to their full potential. Do this for ...
This is a preview of the whole essay
Make sure all the equipment is very close by and ready for use. Make sure the stop clock has not started timing yet and is a 0. The bung must not yet be in the conical flask. The delivery tube must be in the bung. Quickly add the hydrogen peroxide to the conical flask and close the bung. At the same time start the stop clock. Measure the gas evolved every ten seconds. Shake the bottle gently during the experiment to make sure all the enzyme and hydrogen peroxide are used to their full potential. Do this for 80 seconds. Record the results.
After the 80 seconds is over, stop and reset the clock. Wash out the conical flask so there is no hydrogen peroxide or yeast in the flask. Measure out 0.25g of yeast using the electronic scales. Put this in a conical flask. Measure out 6cm of hydrogen peroxide solution using a measuring syringe. Put this in a small beaker. Measure out 4cm of distilled water and add this to the beaker to make a 60% hydrogen peroxide solution.
Make sure all the equipment is very close by and ready for use. Make sure the stop clock has not started timing yet and is a 0. The bung must not yet be in the conical flask. The delivery tube must be in the bung. Quickly add the hydrogen peroxide to the conical flask and close the bung. At the same time start the stop clock. Measure the gas evolved every ten seconds. Shake the bottle gently during the experiment to make sure all the enzyme and hydrogen peroxide are used to their full potential. Do this for 80 seconds. Record the results.
After the 80 seconds is over, stop and reset the clock. Wash out the conical flask so there is no hydrogen peroxide or yeast in the flask. Measure out 0.25g of yeast using the electronic scales. Put this in a conical flask. Measure out 4cm of hydrogen peroxide solution using a measuring syringe. Put this in a small beaker. Measure out 6cm of distilled water and add this to the beaker to make a 40% hydrogen peroxide solution.
Make sure all the equipment is very close by and ready for use. Make sure the stop clock has not started timing yet and is a 0. The bung must not yet be in the conical flask. The delivery tube must be in the bung. Quickly add the hydrogen peroxide to the conical flask and close the bung. At the same time start the stop clock. Measure the gas evolved every ten seconds. Shake the bottle gently during the experiment to make sure all the enzyme and hydrogen peroxide are used to their full potential. Do this for 80 seconds. Record the results.
After the 80 seconds is over, stop and reset the clock. Wash out the conical flask so there is no hydrogen peroxide or yeast in the flask. Measure out 0.25g of yeast using the electronic scales. Put this in a conical flask. Measure out 2cm of hydrogen peroxide solution using a measuring syringe. Put this in a small beaker. Measure out 8cm of distilled water and add this to the beaker to make a 20% hydrogen peroxide solution.
Make sure all the equipment is very close by and ready for use. Make sure the stop clock has not started timing yet and is a 0. The bung must not yet be in the conical flask. The delivery tube must be in the bung. Quickly add the hydrogen peroxide to the conical flask and close the bung. At the same time start the stop clock. Measure the gas evolved every ten seconds. Shake the bottle gently during the experiment to make sure all the enzyme and hydrogen peroxide are used to their full potential. Do this for 80 seconds. Record the results.
The experiment will carry out the aim of the experiment. A graph can be plotted from the results displaying how much gas is evolved at the certain concentrations of hydrogen peroxide. From this another graph can be plotted to show the change in the rate of the reaction of breaking up hydrogen peroxide, using catalyse, is affected by increasing the concentration of hydrogen peroxide.
Fair Test
There are five variables that can affect the rate of reaction in this experiment.
> Temperature
> pH
> Concentration of Enzyme
> Concentration of Substrate
> Inhibitors
To create a fair test certain aspects of the experiment have to be kept the same whilst one key variable is changed. Varying the concentration of the hydrogen peroxide was chosen. This will obtain a varied set of results from which to make a conclusion. If any of the non-variables are not kept constant it will mean the experiment will not be a fair test.
'Temperature has a complex effect on enzyme activity. On one hand, a rise in temperature will increase the kinetic energy of enzyme and substrate molecules and, therefore will tend to increase the rate of a chemical reaction. However, increases in temperature will also affect the stability of the enzyme molecule. The precise shape of the active site is essential for catalytic activity so, if shape changes it will not be able to combine with its substrate. The overall rate of activity will depend upon a balance between these two factors and the enzyme will have an apparent optimum temperature at which it functions more rapidly. At temperatures above this optimum the enzyme rapidly loses its activity and becomes progressively denatured, that is, it is unable to combine with the substrate and therefore has lost its catalytic properties. It should be noted that denaturation is time-dependent, so exposure to a high temperature for a brief period of time will have less effect on the enzyme than prolonged exposure.'
The temperature must be kept constant during the experiment. This will be achieved by doing the experiments in one go, instead of over two or more days. This way the surrounding climate will not change enough to significantly affect the enzyme.
'Most enzymes have a characteristic pH at which they function most efficiently. This is known as the optimum pH. Changes in pH affect the ionisation of side groups in the enzyme's amino acid residues. This in turn affects the overall shape of the enzyme molecule and affects the efficiency of formation of enzyme-substrate complexes. At extremes of pH the enzyme molecule may become denatured. As with optimum temperatures, enzymes have varying optimum pH values. Although many enzymes have optimum at pH values of around 7 (neutral), there are some that function best at extreme values.'
The pH must be kept constant during the experiment. This will be achieved by using distilled water to dilute the hydrogen peroxide. This means no impurities will change the pH of the solution. Distilling the water also makes sure that there will be no difference in the level of impurities in the water so the water's pH will stay constant every time it is used.
'As the concentration of enzyme increases, the number of active sites also increases. Provided that there is an excess of substrate molecules, the rate of reaction increases in proportion to the concentration of enzyme.'
The amount of enzyme in each experiment must be kept constant in every test. This way the number of active sites is kept constant so the test is fair. 0.25g of yeast will be used every time.
'Inhibitors are substances that reduce the activity of enzymes. They act by interfering with the activity of the active site, either directly or indirectly. There are several different types of inhibitors, which can be reversible (if they bind reversibly with the enzyme) or irreversible (if they bind permanently to the enzyme).
Some reversible inhibitors bind to the active site of the enzyme. These are known as competitive inhibitors because they will compete for the active site with the substrate. Many competitive inhibitors have a similar shape to the substrate and will bind to the active site, preventing the substrate from binding with the same active site. The presence of the inhibitor will therefore reduce the rate of reaction, but competitive inhibitors can be displaced from the active site by the substrate if the substrate is in high concentration, restoring catalytic activity'
'Irreversible inhibitors attach tightly to the enzyme molecule so that it loses its catalytic properties.'
To make the experiment fair the number of inhibitors in the solution must always be kept constant. The best way of doing this is by never putting any in. This can be regulated by using distilled water. Distilled water is filtered and separated from all the impurities which may have acted as inhibitors during the experiment.
Another important factor is making sure the distilled water does not become contaminated with the distilled water. If one measuring syringe is used then there is a high chance of contaminating the distilled water by using the same syringe for both. It would transfer hydrogen peroxide into the distilled water. Both liquids are colourless so the difference would be hard to tell. Two syringes would therefore be used. One will be for the distilled water and the other for the hydrogen peroxide. This will keep both the hydrogen peroxide and distilled water separated from each other.
By keeping all the non-variables constant, the test will be fair. As long as only the variable in question, concentration of hydrogen peroxide, is being tested the experiment should test my hypothesis well.
Quotations extracted from the A-Level study guide 'Molecules and Cells' by John Adds, Erica Larkcom and Ruth Miller.
Accuracy
The measurements will be very precise.
A set of scales will be used to measure out the yeast. The scales are electronic and show the reading in digits. This means there can be no fault reading them. They are electronic and can auto-balance, so any unwanted substances already on the plate will not affect the measurement. They measure up to a hundredth of a gram so are very accurate.
The stop watch is also electronic so there is not likely to be any fault in reading the measurement. It can measure to the nearest millisecond, which is more accurate than needed.
Measuring syringes will be used to measure the hydrogen peroxide and distilled water. Syringes are much more accurate and controllable than measuring cylinders.
A gas syringe will be used to measure the gas evolved from the conical flask. The gas syringe is expected to be very accurate. The overall accuracy of the results relies upon this piece of equipment so it must not be faulty.
The main fault in the experiment is trying to add the hydrogen peroxide solution to the conical flask, close the bung and start the stop clock at the same time. If this is done wrong it could result in spilling the acid, loss of gas and/or timing the experiment wrong. However, if these are done correctly, in the right order and with the same efficiency then a reliable conclusion can still be drawn.
All points mentioned in the fair test will be accounted for so that the experiment and results are reliable. The whole experiment will be repeated twice so anomalous results can be observed easily and a mean average can be taken of the results. This mean average will be more accurate. The range used is good and sufficient to observe a correlation from if there is one. If this correlation is present then it should agree with the scientific theory stated in the hypothesis. Because of this the experiment is a good way of testing the hypothesis, i.e. if there is a correlation and if it agrees with the theory stated.
This method is a good way of testing the hypothesis. The equation for the reaction is:
This shows that oxygen is a product of the reaction. By measuring the oxygen given off at certain times is, therefore, measuring the rate at which oxygen is released by the reaction. This is measuring the rate of reaction. Comparing the different measurements at different concentrations of hydrogen peroxide is effectively comparing different rates of reaction at different concentrations of hydrogen peroxide. This is exactly what I am testing so method is a good way of testing the hypothesis.
Preliminary Work
I ran a preliminary experiment to test the method and establish the highest and lowest concentration of hydrochloric acid, which I am going to use. The results are shown below.
20% Concentrated Hydrogen Peroxide Solution
Time (sec)
Gas evolved (cm3)
0
7
20
24
30
27
40
27
50
28
60
28
70
28
80
28
90
28
00
28
00% Concentrated Hydrogen Peroxide Solution
Time (sec)
Gas evolved (cm3)
0
35
20
45
30
55
40
65
50
70
60
70
70
70
80
70
90
70
00
70
The trial experiment worked well so my method is tested and proven.
Results
20% Concentrated Hydrogen Peroxide Solution
Time (sec)
Experiment 1
Gas evolved (cm3)
Experiment 2
Gas evolved (cm3)
Experiment 3
Gas evolved (cm3)
0
7
9
8
20
6
6
8
30
6
7
9
40
6
7
9
50
6
7
9
60
6
7
9
70
6
7
9
80
6
7
9
90
6
7
9
00
6
7
9
40% Concentrated Hydrogen Peroxide Solution
Time (sec)
Experiment 1
Gas evolved (cm3)
Experiment 2
Gas evolved (cm3)
Experiment 3
Gas evolved (cm3)
0
7
7
7
20
26
25
26
30
30
30
30
40
30
30
30
50
30
30
30
60
30
30
30
70
30
30
30
80
30
30
30
90
30
30
30
00
30
30
30
60% Concentrated Hydrogen Peroxide Solution
Time (sec)
Experiment 1
Gas evolved (cm3)
Experiment 2
Gas evolved (cm3)
Experiment 3
Gas evolved (cm3)
0
32
30
30
20
40
39
40
30
43
43
44
40
44
44
45
50
46
45
46
60
46
45
46
70
46
45
46
80
46
45
46
90
46
45
46
00
46
45
46
80% Concentrated Hydrogen Peroxide Solution
Time (sec)
Experiment 1
Gas evolved (cm3)
Experiment 2
Gas evolved (cm3)
Experiment 3
Gas evolved (cm3)
0
46
40
40
20
50
47
45
30
55
50
50
40
57
55
56
50
58
57
58
60
59
59
60
70
60
60
60
80
62
61
61
90
62
61
62
00
62
61
62
00% Concentrated Hydrogen Peroxide Solution
Time (sec)
Experiment 1
Gas evolved (cm3)
Experiment 2
Gas evolved (cm3)
Experiment 3
Gas evolved (cm3)
0
43
40
39
20
48
50
48
30
63
60
59
40
65
65
65
50
67
65
65
60
67
66
66
70
67
67
66
80
67
67
67
90
67
67
67
00
67
67
67
Constants
The mass of yeast was 0.25g.
The temperature was room temperature.
The pH level was 7.
There were no inhibitors used.
Analysis
From the results I made an averages table.
Average Gas evolved (cm3) at certain concentrations of Hydrogen Peroxide.
Time(sec)
20%
40%
60%
80%
00%
0
8
7
30
42
41
20
7
26
40
47
48
30
7
30
43
52
61
40
7
30
44
56
65
50
7
30
46
58
66
60
7
30
46
59
66
70
7
30
46
60
67
80
7
30
46
61
67
90
7
30
46
62
67
00
7
30
46
62
67
There is no real point in plotting a graph of these averages as it will not truly help test the hypothesis. It would be better to pick a certain time mark and collect the data at that mark. If a graph is plotted from these points, then it will show the effect of the concentration of hydrogen peroxide on the rate of reaction. This would be more useful to help make a good conclusion. The best time mark to use is 100 seconds as this is when all the reactions have finished and no more gas has been evolved. The table below shows the information:
Concentration of Hydrogen Peroxide Solution (%)
Gas Evolved (cm3)
20
7.33
40
30.00
60
45.67
80
61.67
00
67.00
Analysis
From observing the graph it is clear there is a correlation between the points. At first glance it seems as though the line of best fit was a straight line showing direct proportionality and the last point is anomalous. This is not the case. The line of best fit actually has a decreasing gradient so is curved. Although the amount of gas evolved is greater, the difference between the values is decreasing.
This proves my hypothesis correct.
Conclusion
The hypothesis was proven correct. I was correct in predicting that as the concentration of hydrogen peroxide increases, the gas evolved increases, but only until all the enzyme molecules are at work. At this point the enzyme is said to be 'saturated'. After this the rate of reaction can increase no more.
'If the concentration of substrate is increased, but the concentration of enzyme remains constant, the rate of reaction will increase as the substrate concentration increases, but only until all the enzyme molecules are being used. At this point all the enzyme molecules are at work. After this point, no matter how much more substrate is added, the enzymes are working as fast as they can, so the rate of reaction reaches a maximum velocity and remains constant. This rate is referred to as Vmax.'
Quoted from the A-Level study guide 'Molecules and Cells' by John Adds, Erica Larkcom and Ruth Miller.
The last point on the graph showed a decrease in gradient so shows that the rate of reaction was getting near to Vmax. This proves I was correct in saying the graph would have a decreasing gradient.
All the predictions made in my hypothesis were correct.
Evaluation
The experiment was a very good way to test the hypothesis. All the points mentioned in the fair test were carried out so there was little room for fault. The range of results was comprehensive and resulted in a good conclusion. Both the original and repeated results were reliable so the overall mean proved very useful. The fact that there was a mean also meant a good graph could be drawn. There were no anomalous results so an accurate line of best fit was drawn.
There were some limitations to the experiment that were beyond my control. The large marble chips did vary somewhat in surface area. This resulted in a fluctuation of active sites during the reaction. However these variations did not seem to affect the results significantly.
The main fault in the experiment is trying to add the hydrogen peroxide solution to the conical flask, close the bung and start the stop clock at the same time as explained earlier. This is the most likely reason for the slight fluctuations in the results but even these were not significant enough to cause any anomalies.
All in all the experiment was well carried out and good results were achieved. The hypothesis was tested and proved well.
An improvement to the experiment would be more repeats as this would give the opportunity for a more reliable mean average. Aside this I think this was the best method to test the hypothesis.
The reaction used was:
Oxygen is a product of the reaction. By measuring the oxygen given off at certain times is, therefore, measuring the rate at which oxygen is released by the reaction. This is measuring the rate of reaction. Comparing the different measurements at different concentrations of hydrogen peroxide is effectively comparing different rates of reaction at different concentrations of hydrogen peroxide. This is exactly what I tested so method is a good way of testing the hypothesis. It would be extremely hard to measure the amount of water evolved so gas is the better choice.
The best way to carry on the experiment and provide additional evidence would be to try and find the maximum rate of reaction, Vmax, for this particular reaction. This could be done by using a much larger volume of hydrogen peroxide solution so points on both side of Vmax can be found. From this a graph, like the one in the hypothesis, could be drawn. This would prove my hypothesis even better.